How to digitize your chart, graph or type log
 Summary: How to digitize your chart, graph or type log
Article by: Kyle Gray
Gray Technical, LLC – CEO
 We live in an age where everything is digital. Paper is obsolete, books are PDF’s, newspapers are converting into blogs and paper charts are now slowly becoming all digital. This is not necessarily a bad thing when you consider the amount of space and time is saved when storing and sorting. But this simple fact that we are becoming more accustomed too raises a red flag; what can you do with your paper charts, graphs and type logs that were once so important? You have the original charts, but no data, now what? Or let us assume that you stored the data as a scanned image instead of re-plotting it, you are pretty much in the same predicament. What can you do?
There are two answers to this. First is to retype all of your data and create your chart and graphs again. The second option is the easy, more time saving and accurate way; to digitize them using software.
Steps in digitizing
Several digitizing programs are available on the internet and, for the most part, all consist of the same four basic steps:

1. Open the desired image file
2. Set the scale (minimum and maximum)
3. Digitize your chart, graph or type log image
4. Export your digitized data
Seems simple, right? Well, it is. That is truly all there is to it. In the section below we are going to be breaking down each step into an easy, follow-along tutorial. Most images and charts can be digitized within seconds. Larger documents, like type logs and wireline graphs might take a little longer, but regardless it should only take a couple minutes with the correct software.
Tutorial: How to digitize charts, graphs and type logs
![]() The software we will be using is Log Evolve. Log Evolve is a digitizing software that was created for the use of digitizing type logs, which are massive line graphs used the geology field to read data of soil and rock samples. Because of this Log Evolve has several very unique features that we will be showcasing in this tutorial.
The software we will be using is Log Evolve. Log Evolve is a digitizing software that was created for the use of digitizing type logs, which are massive line graphs used the geology field to read data of soil and rock samples. Because of this Log Evolve has several very unique features that we will be showcasing in this tutorial.
Please keep in mind though, the same basic steps apply for nearly all digitizers, but some features may vary.

On the features that are exclusive to Log Evolve we will have the following box around that portion of the tutorial.
These options, while exclusive to Log Evolve will not hinder your progress when digitizing and can be skipped over if wanted. It is recommended that you read all of the details though so you will know what to do if the need arises to use one of these features.
Step 1: Open the desired image file
The first step is to locate and open the selected image into Log Evolve by going to File > Open and Image. Acceptable file types are JPG (JPEG’s), PNG, TIFF, BMP (bitmap) and GIF images.
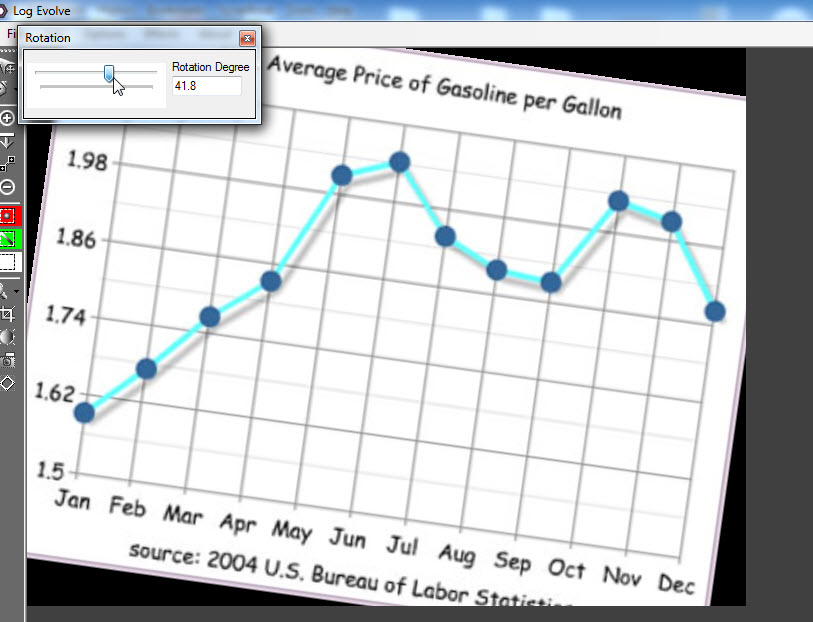 Once your image is opened you might notice that the image was scanned in at an angel. With most digitizing software this would be a problem as they are not designed to compensate for this factor. Log Evolve however comes with its own image editing capabilities. Images can be rotated by set degrees, adjusted in brightness and even allow for filters to better display the graph.
Step 2: Set the scale

After your image is set and ready to digitize start by clicking the ‘Line-Up Log’ button located at the top right of the software. The active graph will then populate. Drag the graph and line up the edges of the graph with the edges of your image on the shortest axis. Once the shortest axis is lined up you can either line up the entire image (if it is visible on the screen) or just line up the nearest known points on the opposite axis, as before.
Once the chart is lined up on both the X and Y axis it is time to set your scale and limits. On the right of the screen you can see the Minimum and Maximum values for both your X and Y axis. These numbers represent the orientation of the chart over the image. Fill in the corresponding numbers as they appear under the chart.
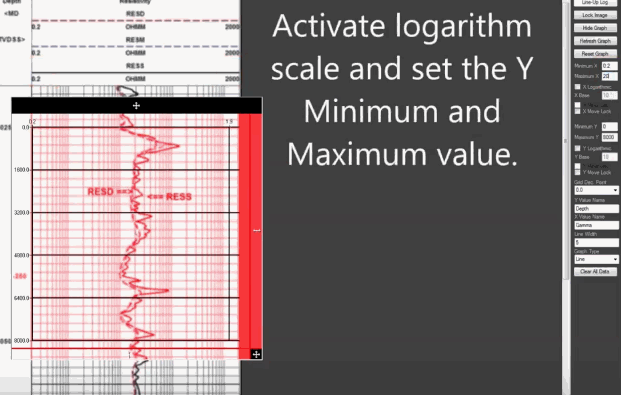 It is at this point where we can specify that the image is either a standard graph or a logarithmic graph. By selecting the logarithmic option you can see that the chart change to an exponential calculation. By default Log Evolve will assume that a new image is a standard graph.
Step 3: Digitize your chart, graph or type log
In Log Evolve, the second tool down on the left side of the screen is called the Pen Tool. Select this tool and go to your chart. With this tool selected either click on your chart where the type log data is, or hold down with your left mouse button to add points.
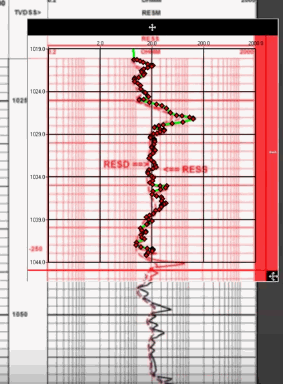 When advancing the chart you will notice the data points relocate and find their previous location. This is the AI in action, advancing your data so you can continue digitizing your chart without starting over like most digitizers would make you do.
Step 4: Export your digitized data
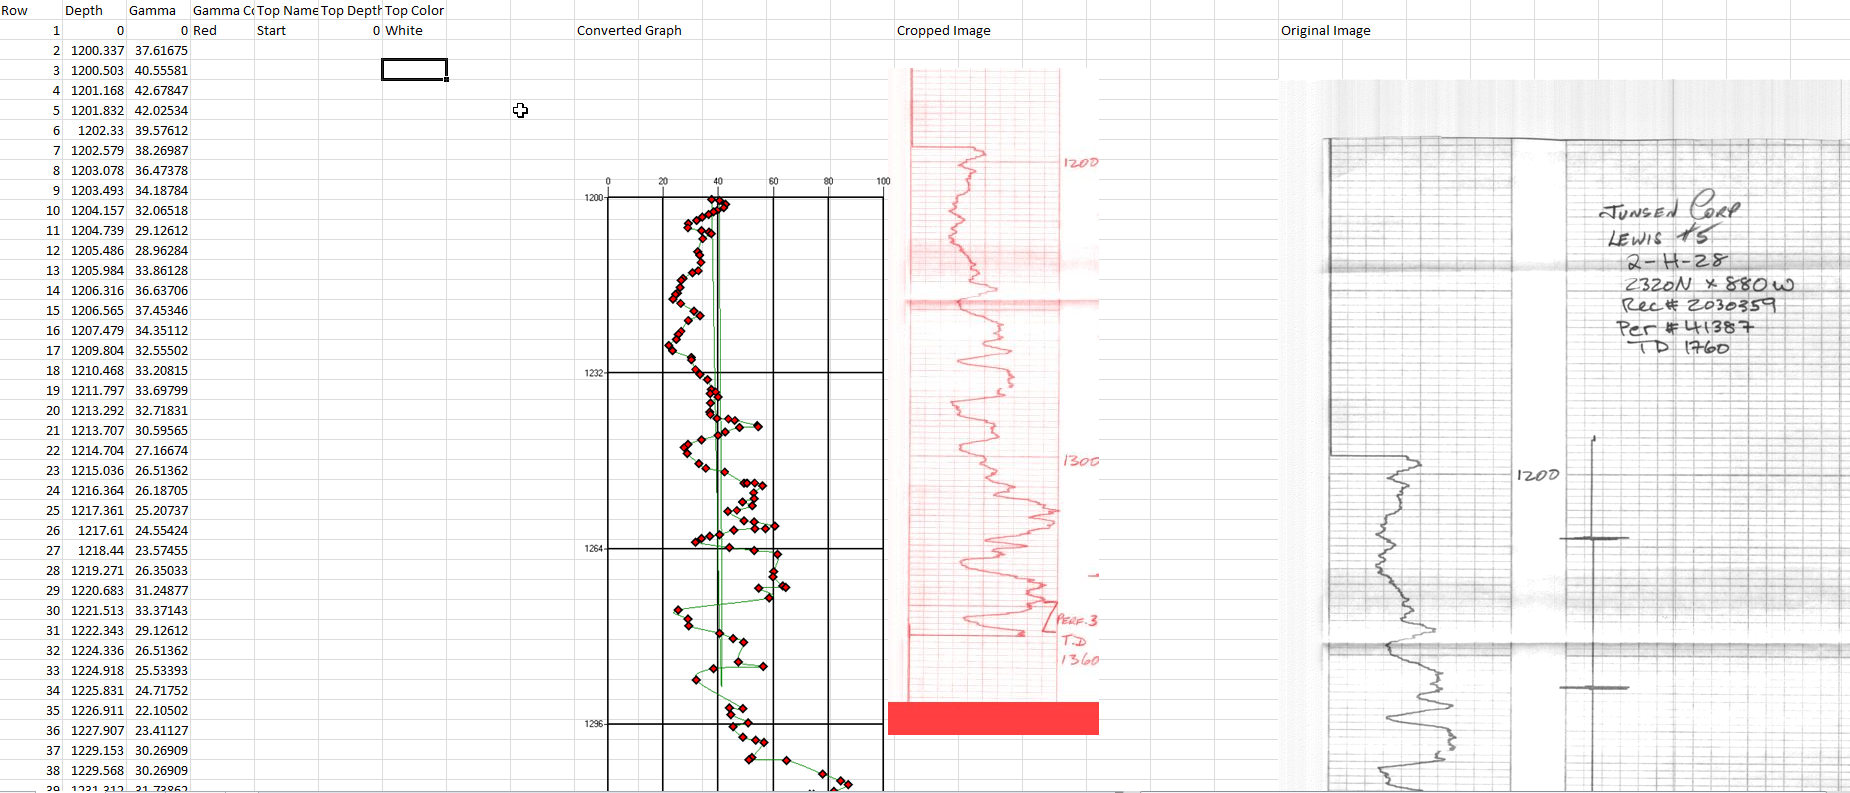 Once your image is digitized you will need to export the data. To do this go to File > Save As and you can chose to either export this as a Project File (which is a compressed ZIP document), an Excel document or a CSV file.
 When you export your data into Excel with Log Evolve another window will appear asking you for information regarding your company, the digitized image and the client (if one is applicable). All of this information is optional and is also programmable if wanted. This can hold information like your companies name, the employee that digitized the image, the client that is getting the image, the date it was originally made, the date it was digitized and many more. Of course, as stated before, all of this is optional and is not required to export.
Click here to download a Log Evolve Excel exported digitized well log.
Conclusion
Eventually everything will be going digital, one way or another. Of course you could never substitute a good hard-cover book or your local newspaper for a PDF, but what you can do is remove some clutter from your office by reusing old archived charts. As stated before, all four of the basic steps rein true in nearly all digitizers; locate/open, set minimum/maximum, digitize, export. It is really that simple. But if you want the added benefits of Excel exportation, addition of tops/break points, chart advancing artificial intelligent units, color and logarithmic options then Log Evolve is the best way to digitize.
If you like this post and would like to subscribe to our newsletter to learn more about Gray Technical please follow this link.
As always if you would like to contact us for help or information please email us at support@graytechnical.com
![]()
 Previous Post
 Next Post


