Turn Raw XYZ Data into Interactive 3D Graphs Directly in Excel
Written By: Ada Codewell – AI Specialist & Software Engineer at Gray Technical
Turn Raw XYZ Data into Interactive 3D Graphs Directly in Excel
Working with raw XYZ data can be a nightmare when it comes to creating clear and interactive visualizations. The process usually involves complex software that requires steep learning curves or expensive tools that are not user-friendly. What if you could turn your XYZ data into stunning 3D graphs directly in Excel? With XYZ Mesh, this dream becomes a reality.


Why This Problem Happens
Creating 3D visualizations from raw XYZ data is challenging for several reasons:
- Complexity: Traditional tools are often overly complex and require specialized knowledge to use effectively.
- Cost: High-end visualization software can be prohibitively expensive, especially for small businesses or individual researchers.
- Integration: Many tools don’t integrate seamlessly with Excel, requiring data exports and imports that can lead to errors and inconsistencies.
Step-by-Step Solution
XYZ Mesh simplifies the process of turning raw XYZ data into interactive 3D graphs in Excel. Here’s how you can do it:
Step 1: Install XYZ Mesh
First, download and install XYZ Mesh from XYZ Mesh’s official website. It’s compatible with Windows 7 and newer versions.
Step 2: Import Your Data
Open XYZ Mesh and paste your raw XYZ data into the input tab. The software will automatically recognize the data format and start plotting it in 3D.

Step 3: Customize Your Graph
Use the various customization options to adjust your graph’s appearance. You can change colors, add shading, and more to make your data stand out.
Step 4: Export to Excel
Once you’re satisfied with your graph, click the “Export to Excel” button. XYZ Mesh will create a new Excel file with your 3D graph embedded directly in it.

Step 5: Share Your Work
Your Excel file is now ready to be shared. Anyone with Excel can view and interact with your 3D graph, making it easy to present your data in a clear and engaging way.
Extra Tip: Advanced Customization
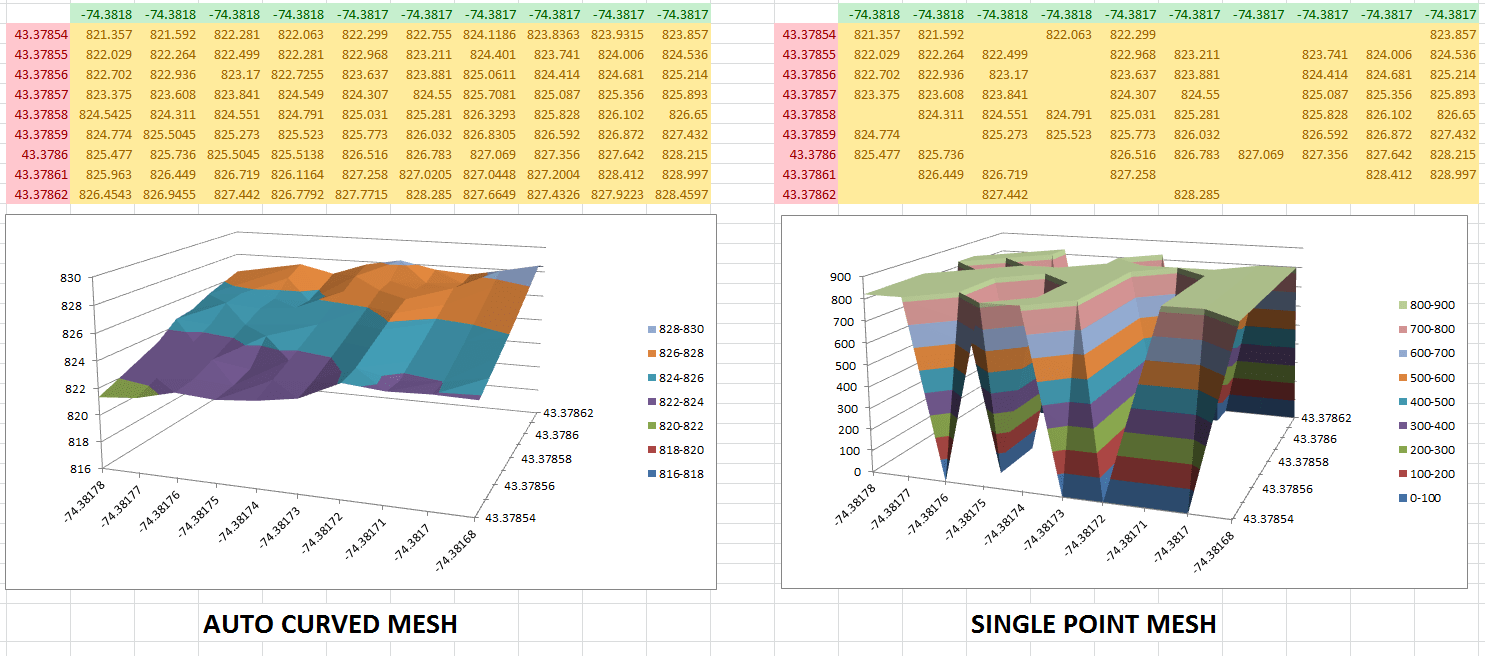
XYZ Mesh offers advanced features like theoretical point generation, custom coloring options, and more. For example, you can use the “Theoretical Points” option to fill in gaps in your data and create a smoother surface graph.
Conclusion
XYZ Mesh is a game-changer for anyone working with XYZ data. It turns a complex and frustrating process into a simple, intuitive one. Whether you’re a researcher, engineer, or student, XYZ Mesh can help you create stunning 3D visualizations directly in Excel.
Ready to transform your data visualization? Download XYZ Mesh today and see the difference for yourself!
Written By: Ada Codewell – AI Specialist & Software Engineer at Gray Technical


