
Transforming XYZ Data into Interactive 3D Graphs with Excel
Written By: Ada Codewell – AI Specialist & Software Engineer at Gray Technical
Transforming XYZ Data into Interactive 3D Graphs with Excel
Are you tired of struggling with Excel’s 3D charts? They’re often difficult to create and even harder to interpret. What if you could transform your raw XYZ data into stunning, interactive 3D surface plots in seconds? That’s exactly what XYZ Mesh allows you to do.

The Problem: Excel’s Limitations with 3D Graphs
While Excel is fantastic for basic charts and spreadsheets, creating actual 3D surface plots is difficult and time-consuming. Most users find that it takes 45 minutes or more to create a simple 3D graph, often resulting in a chart that’s hard to interpret.
Why Does This Happen?
The issue lies in Excel’s inherent limitations when it comes to handling complex 3D data. Most 3D visualization tools require proprietary formats and special viewers, which can be cumbersome for users who just want to create and share professional graphs.
Introducing XYZ Mesh
XYZ Mesh is a game-changer. It converts XYZ data directly into professional 3D visuals, Excel animations, and shareable plots in seconds. With XYZ Mesh, you can export to native Excel formats, EXE, DXF, and KML, making it easy to integrate with any workflow.
XYZ Mesh is built for surveyors, engineers, geologists, researchers, and consultants, and has been trusted by professionals for over a decade. Thousands of exports have been used in engineering, surveying, and research projects worldwide.
3 Real-World Examples
Example 1: Topographic Mapping
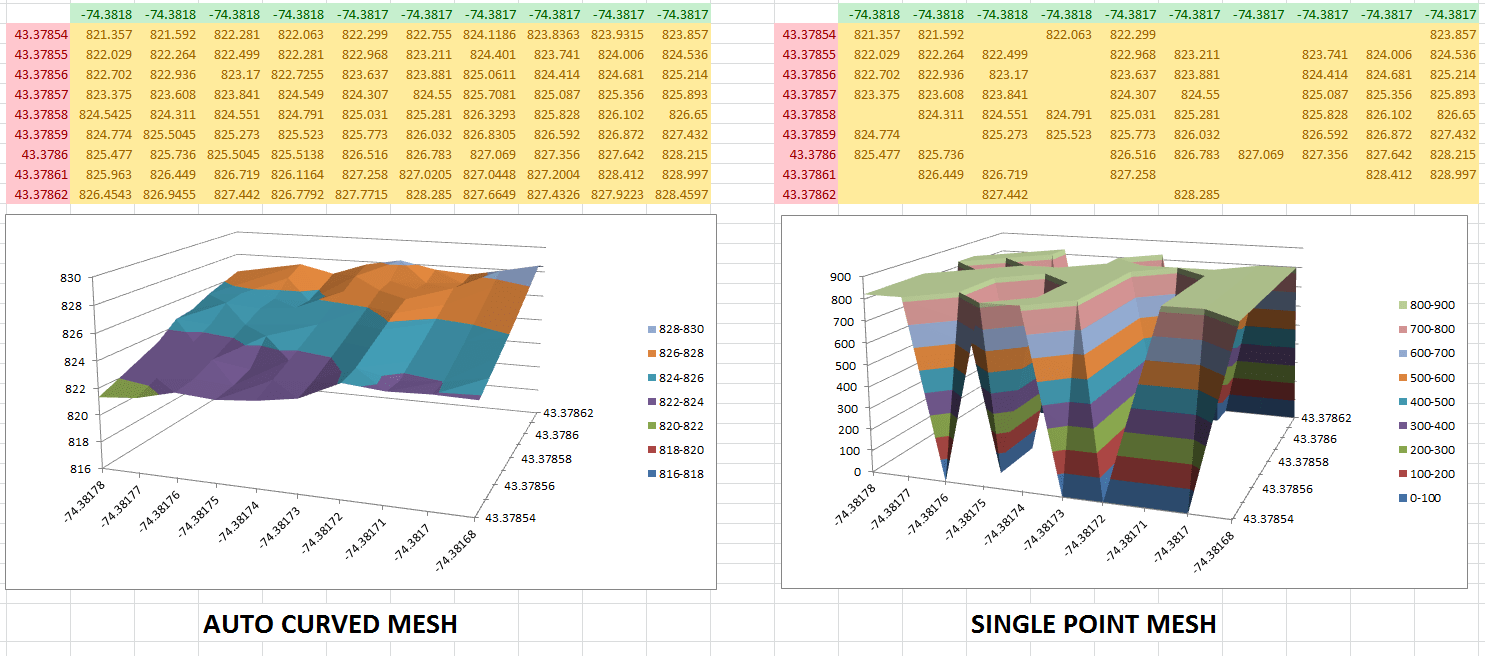
Surveyors often need to create topographical maps to analyze terrain. With XYZ Mesh, you can take raw XYZ data from your survey and quickly convert it into a 3D surface plot that clearly shows the structure and topology of the land.
Example 2: Geological Analysis
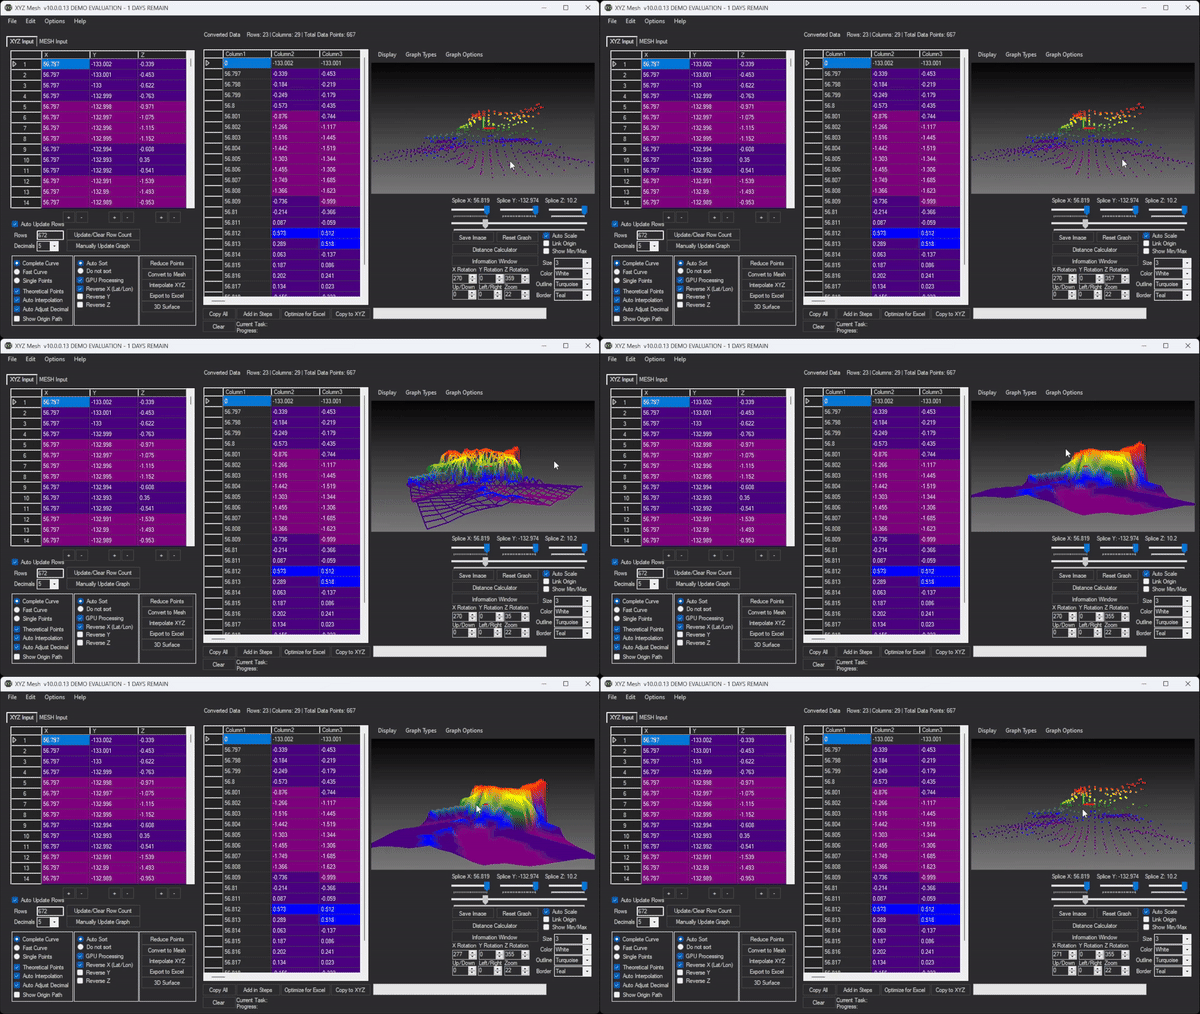
Geologists can use XYZ Mesh to analyze geological features. For instance, they can convert data from a seismic survey into a 3D model that helps them understand fault lines and subsurface structures.
Example 3: Engineering Design

Engineers can use XYZ Mesh to visualize designs and structures. For example, civil engineers can create 3D models of proposed bridges or buildings to analyze stress points and design flaws before construction begins.
Step-by-Step Solution
Here’s how you can transform your XYZ data into interactive 3D graphs using XYZ Mesh:
- Collect Your Data: Gather your XYZ point cloud data from any source such as survey equipment, drones, or simulation software.
- Copy and Paste: Open XYZ Mesh and paste your data into the input window. The software automatically detects the format and plots it in 3D.
- Convert to Mesh: Use XYZ Mesh’s built-in tools to convert your data into a smooth, interactive mesh that fills in any gaps and calculates missing data points.
- Customize Your Graph: Adjust colors, textures, and other visual settings to make your graph visually appealing and informative.
- Export to Excel: Export your 3D graph directly into Excel. The graph will be fully interactive, allowing you to rotate, zoom, and pan within the Excel environment.

Advanced Tips and Variations
Curving Data: One of XYZ Mesh’s standout features is its ability to curve data, ensuring that your 3D surface plot is smooth and professional. This feature is particularly useful when dealing with irregular or incomplete datasets.
Interpolation: If you need to fill in gaps without converting to a mesh, use XYZ Mesh’s interpolation feature. This will produce points not yet present and calculate data for empty points while keeping your data in XYZ format.
Conclusion
XYZ Mesh transforms the way you handle 3D data in Excel. It’s fast, easy to use, and produces stunning, professional results that are shareable with anyone who has Excel. No more wrestling with complex charts or struggling with proprietary formats.
Ready to elevate your data visualization? Give XYZ Mesh a try today and experience the difference for yourself.

Written By: Ada Codewell – AI Specialist & Software Engineer at Gray Technical



















