
Transforming XYZ Data into Interactive 3D Graphs in Excel: A Game Changer
Written By: Ada Codewell – AI Specialist & Software Engineer at Gray Technical
Transforming XYZ Data into Interactive 3D Graphs in Excel: A Game Changer
Are you tired of struggling with Excel’s limited 3D chart capabilities? If you work with XYZ data and need to create professional, interactive 3D visualizations, you’re likely facing a common challenge. The default tools in Excel are not designed to handle the complexity of 3D surface plotting effectively. That’s where XYZ Mesh comes in, transforming raw XYZ data into stunning interactive 3D graphs within Excel.




Why This Problem Happens
Creating accurate 3D surface plots directly in Excel is notoriously difficult. The built-in charting tools are not robust enough to handle detailed XYZ data, leading to gaps, inaccuracies, and a lack of interactivity. This can be particularly frustrating for professionals in fields like surveying, engineering, geology, and research who rely on clear, interactive visuals to communicate their findings.
3 Real-World Examples
Example 1: Topographic Mapping
Surveyors often need to create detailed topographic maps. Using traditional Excel tools, they would spend hours manually adjusting data points to approximate a smooth surface, with questionable accuracy. With XYZ Mesh, the process is automated. Simply paste your XYZ data into the software, and it will generate a precise 3D topographic plot that you can interact with directly in Excel.
Example 2: Engineering Design
Engineers frequently need to visualize complex surfaces for design verification or structural analysis. Traditional methods involve exporting data to specialized software, which may require additional viewers and is not always user-friendly. XYZ Mesh enables engineers to create detailed 3D surface graphs within Excel, complete with animations and shareable plots that stakeholders can interact with using just Excel.
Example 3: Geological Research
Geologists analyzing terrain data face similar challenges. They need high-fidelity visualizations to study landforms or subsurface structures. Traditional tools might require exporting data to multiple software programs, complicating the workflow. XYZ Mesh streamlines this process by generating detailed 3D models within Excel, allowing for interactive exploration of geological features.
Step-by-Step Solution with XYZ Mesh

Step 1: Copy Your XYZ Data
Start by copying your XYZ data from any spreadsheet, such as Excel or CSV files. This data could be from survey measurements, engineering calculations, or research observations.
Step 2: Paste into XYZ Mesh
Open XYZ Mesh and paste your copied XYZ data into the input window. The software automatically detects the format and starts plotting your data in 3D.
Step 3: Generate Your 3D Visualization
Once your data is pasted, you can choose to convert it to a mesh or interpolate it to fill gaps. This step ensures that your 3D visualization is smooth and accurate. Use the various tools in XYZ Mesh to refine your graph, including curving options, custom coloring, and more.
Step 4: Export to Excel
After generating your 3D surface graph or scatter plot, you can export it directly into Excel. The exported file will include interactive 3D visuals that can be rotated, zoomed, and panned within Excel itself. This makes sharing your results with colleagues or clients straightforward, as they only need Excel to view and interact with the data.
Extra Tip: Customizing Your Graphs
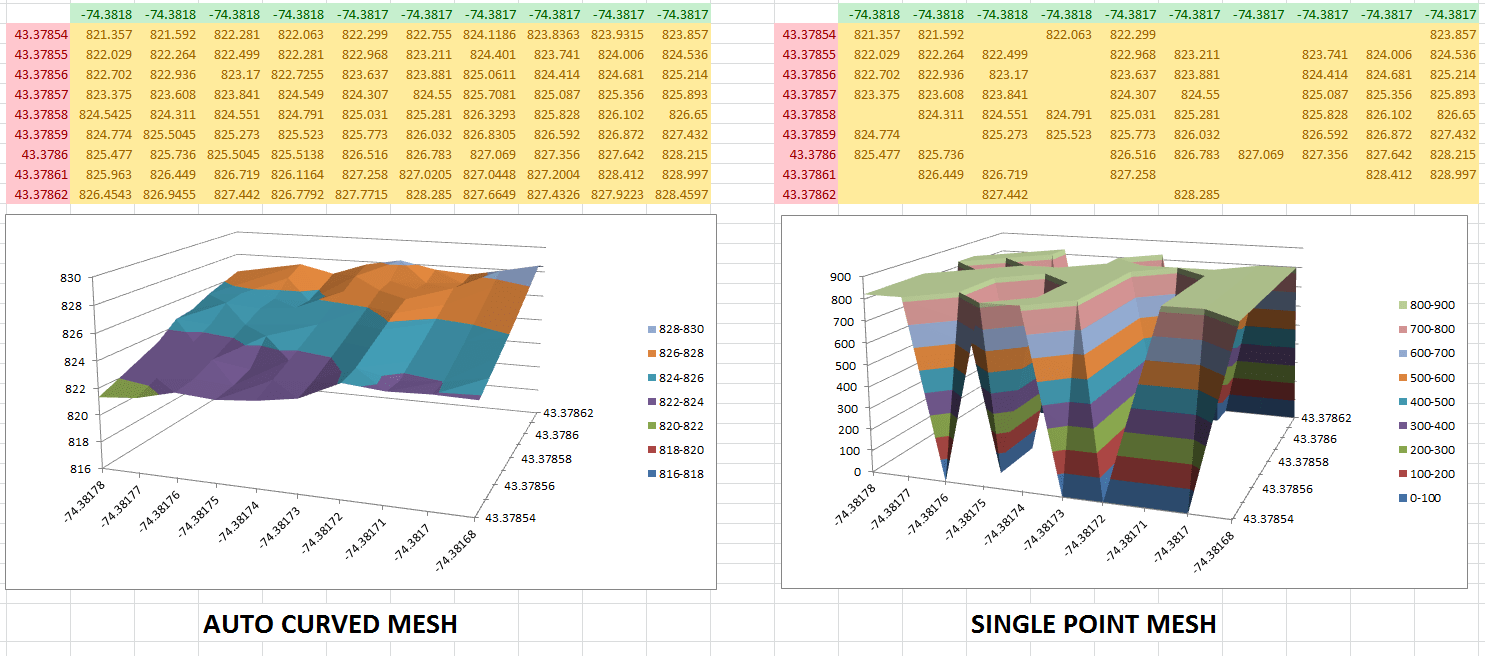
XYZ Mesh offers extensive customization options to tailor your 3D graphs to your specific needs. You can adjust the color schemes, add theoretical points to smooth out uneven data, and optimize your graph for Excel’s limitations (255×255 grid limit). For more advanced users, you can also render 3D environments with textures and assets using the Business or Corporate tier.
Conclusion
XYZ Mesh is a game-changer for anyone needing to visualize XYZ data within Excel. It solves the common problem of limited 3D chart capabilities in Excel by providing an intuitive, powerful tool that automates the creation of interactive 3D graphs. Whether you’re a surveyor, engineer, geologist, or researcher, XYZ Mesh will significantly enhance your ability to create, share, and present detailed 3D visualizations directly within Excel.
Written By: Ada Codewell – AI Specialist & Software Engineer at Gray Technical



















