Transforming Raw XYZ Data into Interactive 3D Graphs with XYZ Mesh
Written By: Ada Codewell – AI Specialist & Software Engineer at Gray Technical
Transforming Raw XYZ Data into Interactive 3D Graphs with XYZ Mesh
Working with raw XYZ data can be a challenging task, especially when you need to visualize it in a meaningful way. Excel is a powerful tool, but creating complex 3D graphs directly within it can be frustrating and time-consuming. This is where XYZ Mesh comes in, offering a seamless solution for converting raw XYZ data into interactive 3D graphs that you can use directly in Excel.
![]()
Why the Pain Point Happens
Creating 3D graphs from raw XYZ data directly in Excel is challenging for several reasons:
- Complexity: Excel’s native graphing tools are limited, making it difficult to create detailed 3D visualizations.
- Time-consuming: Manually setting up and adjusting graphs can take hours of work.
- Accuracy: Ensuring that the data is accurately represented in a 3D space without gaps or distortions is a complex task.
Three Real-World Examples of XYZ Data Visualization Challenges
Let’s look at some real-world scenarios where transforming XYZ data into 3D graphs can be particularly challenging:
Example 1: Geological Surveys
Geologists often need to visualize subsurface geological formations to understand the distribution of minerals, shale layers, or other features. The raw XYZ data from survey measurements needs to be converted into a 3D model that can reveal patterns and structures.
Example 2: Oceanic Farming
In oceanic farming, researchers monitor various environmental parameters like temperature, salinity, and nutrient levels at different depths. Visualizing this data in 3D can help in understanding the spatial distribution of these factors and their impact on marine life.
Example 3: Conservation Efforts
Conservationists often need to map out wildlife habitats using topographical data. Being able to visualize the terrain in 3D helps in planning conservation strategies and monitoring changes over time.
Step-by-Step Solution with XYZ Mesh
XYZ Mesh offers a straightforward, step-by-step solution to convert raw XYZ data into interactive 3D graphs that can be used directly in Excel:
Step 1: Install XYZ Mesh
First, download and install XYZ Mesh. The installation process is simple and straightforward.
Step 2: Import Your Data
Open XYZ Mesh and import your raw XYZ data. You can paste the data directly into the application or import it from a CSV file.

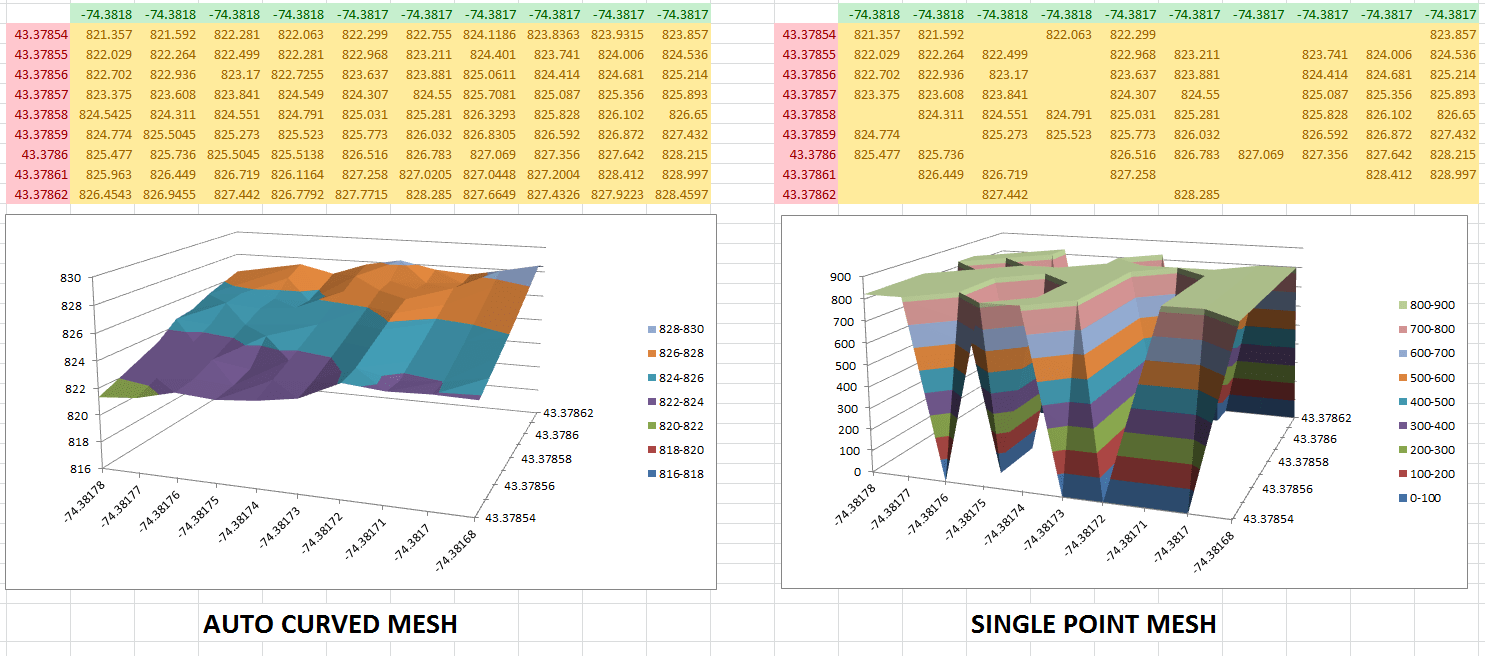
Step 3: Convert to MESH
Use XYZ Mesh’s conversion tools to transform your raw XYZ data into a format that can be used for 3D visualization. The software automatically fills in gaps and calculates theoretical data points to ensure accuracy.
Step 4: Customize Your Graph
Customize the appearance of your 3D graph using XYZ Mesh’s various options, such as color schemes, shading effects, and axis settings. You can also adjust the scale and orientation to best represent your data.
Step 5: Export to Excel
Once you’re satisfied with your 3D graph, export it directly into Excel. The exported file will include all the data and visualizations, allowing you to share them easily with colleagues or clients.
Extra Tip: Enhancing Your Visualizations
To take your visualizations to the next level, consider using XYZ Mesh’s advanced features:
- Interactive 3D Environments: Create fully interactive 3D models that users can navigate with WASD and mouse controls. This is particularly useful for presentations and demonstrations.
- Custom Textures and Assets: Add textures, paths, and objects to your 3D models to make them more realistic and engaging.
Conclusion with Call to Action
Transforming raw XYZ data into interactive 3D graphs doesn’t have to be a daunting task. With XYZ Mesh, you can create professional-grade visualizations directly in Excel, saving time and ensuring accuracy. Whether you’re working with geological surveys, oceanic data, or conservation efforts, XYZ Mesh provides the tools you need to turn complex data into meaningful insights.
Try out XYZ Mesh today and see how it can revolutionize your data visualization workflow. Download the free trial and start creating stunning 3D graphs with ease!
Written By: Ada Codewell – AI Specialist & Software Engineer


