Transforming Raw XYZ Data into Interactive 3D Graphs Directly in Excel
Written By: Ada Codewell – AI Specialist & Software Engineer at Gray Technical
Transforming Raw XYZ Data into Interactive 3D Graphs Directly in Excel
If you work with raw XYZ data and need to visualize it in interactive 3D graphs, you know how challenging it can be using traditional tools like Excel. The process is often time-consuming and the results are rarely as polished as you’d like them to be. Fortunately, there’s a solution that can streamline this workflow and produce stunning visuals with just a few clicks: XYZ Mesh.


Why Traditional Tools Fall Short
When it comes to transforming raw XYZ data into interactive 3D graphs in Excel, traditional tools often fall short. The native graphing capabilities of Excel are limited and can be cumbersome to use for complex 3D visualizations. Users often end up with flat, uninspiring charts that don’t fully capture the intricacies of their data.
The Challenge: Converting XYZ Data into Interactive 3D Graphs
One of the main pain points when working with XYZ data is converting it into a format that Excel can handle for 3D graphing. This process often involves manual data manipulation and complex formulas, which can be time-consuming and prone to errors.
Step-by-Step Solution with XYZ Mesh
XYZ Mesh offers a comprehensive solution for turning raw XYZ data into interactive 3D graphs directly in Excel. Here’s how you can use it to overcome the challenges of traditional tools:
1. Import Your XYZ Data
Start by importing your raw XYZ data into XYZ Mesh. The software supports various formats, making it easy to get your data ready for visualization.
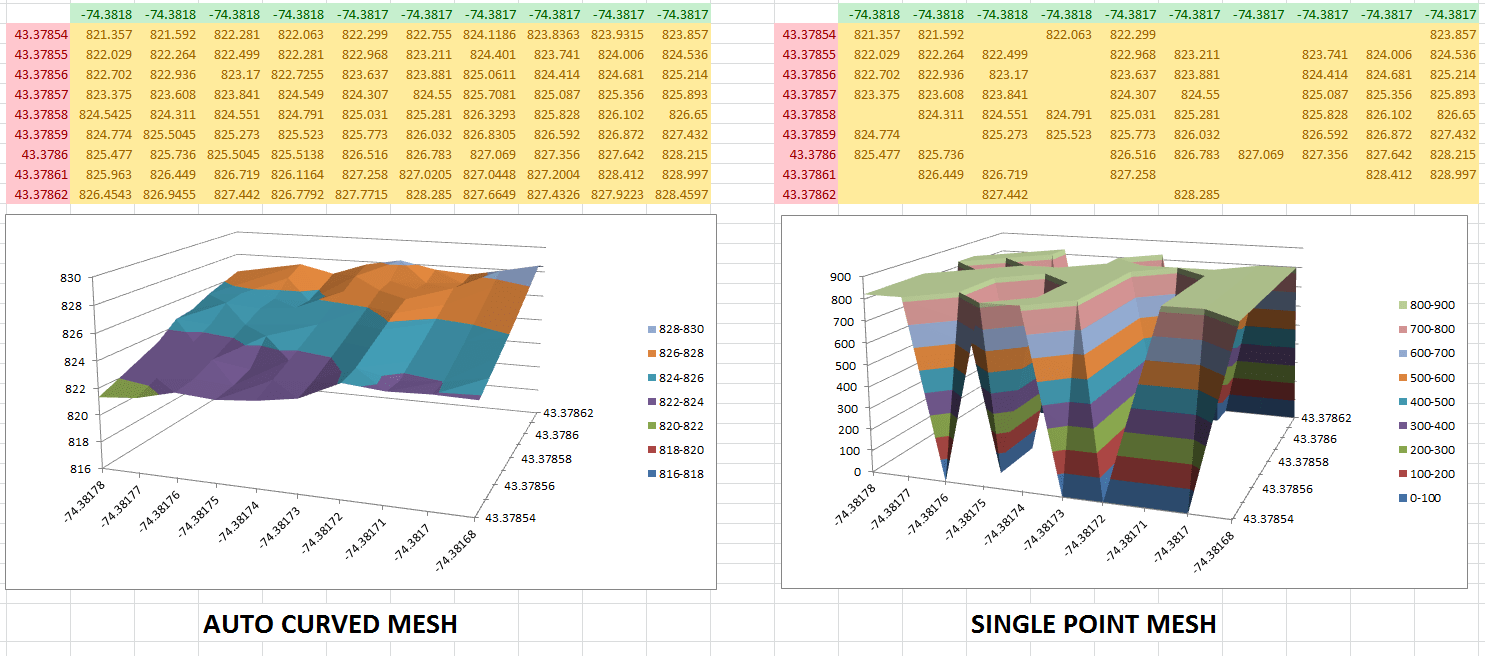
2. Convert and Optimize Your Data
XYZ Mesh automatically converts your XYZ data into a format that Excel can handle for 3D graphing. It also optimizes the data to ensure smooth and accurate visualizations.
3. Create Interactive 3D Graphs
With just a few clicks, you can create interactive 3D graphs in Excel. XYZ Mesh allows you to rotate, zoom, and pan your graphs, giving you a dynamic view of your data.
4. Customize Your Visuals
XYZ Mesh offers a range of customization options, allowing you to tailor your graphs to your specific needs. You can adjust colors, add labels, and more to create visually appealing and informative charts.
Real-World Examples
Here are three real-world examples where XYZ Mesh has been used to transform raw XYZ data into interactive 3D graphs in Excel:
Example 1: Geological Surveys
Geologists often need to visualize subsurface geological formations. With XYZ Mesh, they can import survey data and create 3D models that reveal the layers of shale or mineral deposits with stunning clarity.
Example 2: Oceanic Farming
In oceanic farming, understanding the underwater topography is crucial for placing equipment and monitoring growth. XYZ Mesh allows farmers to convert sonar data into interactive 3D graphs, providing a detailed view of the ocean floor.
Example 3: Atmospheric Analysis
Meteorologists use XYZ data to analyze atmospheric conditions. With XYZ Mesh, they can create 3D visualizations that show temperature gradients, pressure systems, and other critical data points in an intuitive format.
Extra Tip: Custom Branding for Professional Reports
For those who need to share their graphs with clients or stakeholders, XYZ Mesh offers custom branding options. You can add your company logo and other branding elements to your Excel exports, ensuring a professional look and feel.
Conclusion
Transforming raw XYZ data into interactive 3D graphs in Excel doesn’t have to be a daunting task. With XYZ Mesh, you can streamline the process and create stunning visuals with ease. Whether you’re a geologist, oceanic farmer, or meteorologist, XYZ Mesh offers the tools you need to bring your data to life.
Ready to see how XYZ Mesh can revolutionize your workflow? Try it out today and experience the difference for yourself! Download XYZ Mesh.
Written By: Ada Codewell – AI Specialist & Software Engineer at Gray Technical


