
Transforming Raw XYZ Data into Interactive 3D Graphs Directly in Excel
Written By: Ada Codewell – AI Specialist & Software Engineer at Gray Technical
Transforming Raw XYZ Data into Interactive 3D Graphs Directly in Excel
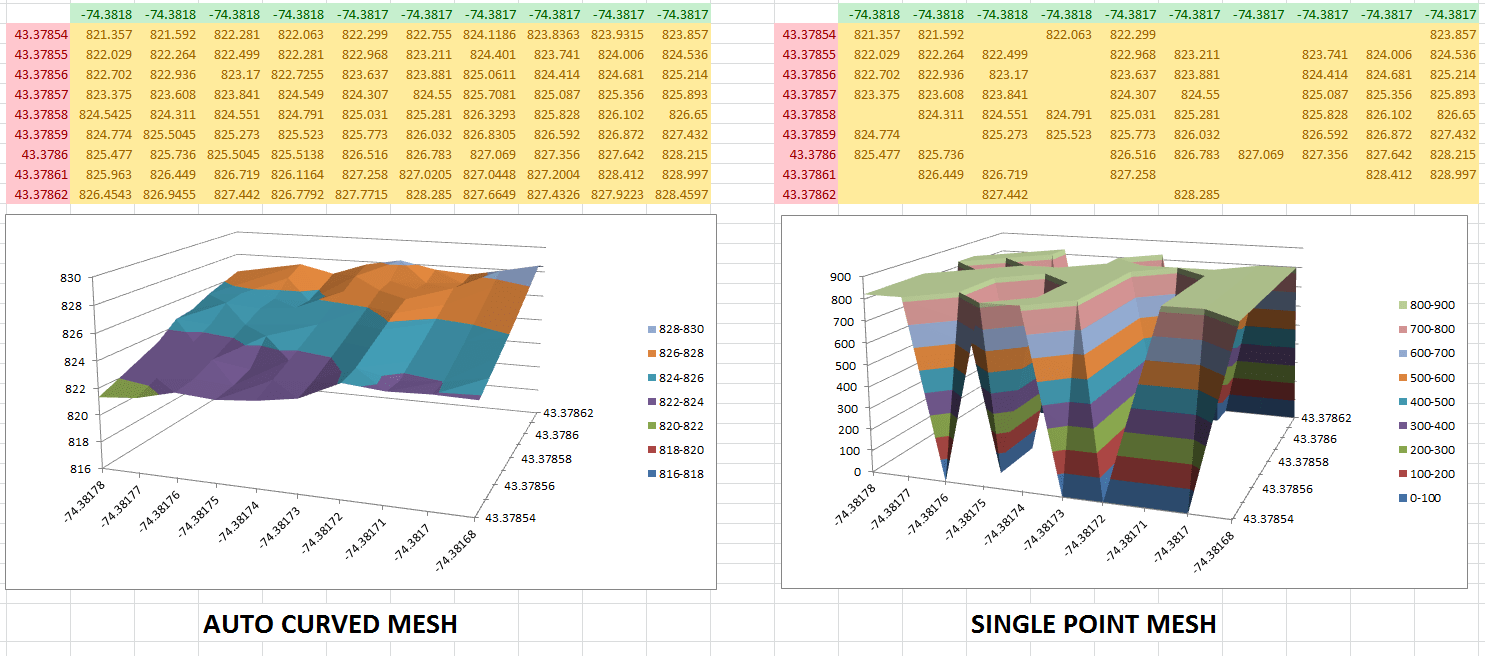
Are you tired of struggling with basic Excel charts that can’t handle 3D surface plots? You’re not alone. Many professionals need to visualize complex data sets, but Excel’s native tools fall short when it comes to creating accurate and interactive 3D graphs from XYZ data. This is where XYZ Mesh comes in—a game-changer for turning raw XYZ data into stunning 3D visualizations directly within Excel.




Why This Problem Happens
Creating accurate 3D surface plots in Excel is challenging because:
- Excel’s built-in chart tools aren’t designed for complex 3D data.
- Manual adjustments are time-consuming and prone to errors.
- Most 3D visualization software requires proprietary formats that need special viewers.
The Solution: XYZ Mesh
XYZ Mesh is a powerful tool designed to bridge the gap between raw data and professional 3D visualizations. Let’s dive into how it works and why it’s an essential tool for professionals dealing with XYZ data.
Step-by-Step Solution
1. Copy Your Data
First, gather your XYZ data from any source—Excel, CSV, or another spreadsheet program. Simply copy the data you want to visualize.
2. Paste into XYZ Mesh
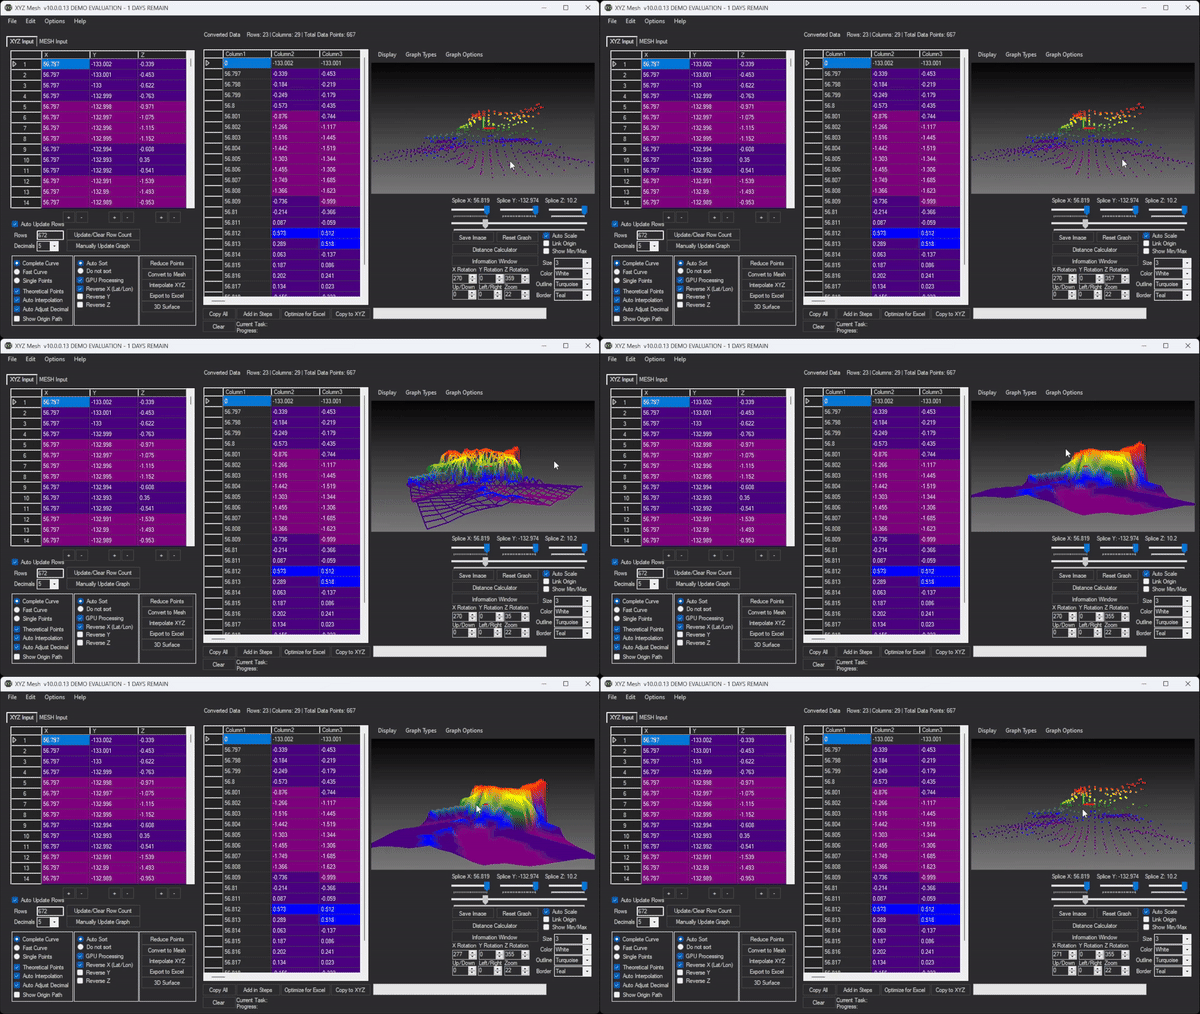
Open XYZ Mesh and paste your copied data into the input window. The software automatically detects the format and plots it in 3D.
3. Customize Your Graph
Use XYZ Mesh’s intuitive interface to customize your graph:
- Choose different graph types like surface, wireframe, or scatter plots.
- Adjust colors based on height, percentages, or custom values.
- Optimize the number of points for better performance in Excel.
4. Export to Excel
Once your graph is perfect, export it directly into Excel. Your clients and colleagues can view, rotate, and interact with your 3D graphs using just Excel—no additional software required!
Real-World Examples
Here are three real-world scenarios where XYZ Mesh shines:
Example 1: Topographic Mapping for Surveyors
Surveyors often need to create topographic maps from raw elevation data. With XYZ Mesh, surveyors can quickly convert their XYZ data into detailed, interactive 3D surface plots that show terrain features in stunning detail.

Example 2: Engineering Design and Analysis
Engineers use XYZ data to model structures, analyze stress points, and visualize fluid dynamics. With XYZ Mesh, they can create precise 3D models that help in design reviews and client presentations.
Example 3: Geological Research
Geologists study the Earth’s surface and subsurface features using XYZ data. XYZ Mesh allows them to visualize geological formations, track changes over time, and share their findings with non-technical stakeholders.
Advanced Features
XYZ Mesh isn’t just about creating basic 3D graphs. Here are some advanced features that make it stand out:
3D Surface Rendering
Create immersive 3D environments with textures, assets, and full navigation controls. Perfect for presentations and detailed analysis.
Volume Calculation
Easily calculate the volume above and below the surface using high and low Z points.
Slope Calculator
Determine slope between points, average slope, highest slope, and lowest slope over an entire mesh conversion.
Conclusion
XYZ Mesh transforms the way professionals handle XYZ data. With its intuitive interface, powerful features, and seamless integration with Excel, it’s a must-have tool for surveyors, engineers, geologists, and researchers. Say goodbye to the limitations of basic Excel charts and embrace the power of interactive 3D visualizations.
Ready to elevate your data visualization game? Try XYZ Mesh today and experience the difference for yourself!
Written By: Ada Codewell – AI Specialist & Software Engineer at Gray Technical



















