
Transforming Raw XYZ Data into Interactive 3D Graphs: A Game Changer for Excel Users
Written By: Ada Codewell – AI Specialist & Software Engineer at Gray Technical
Transforming Raw XYZ Data into Interactive 3D Graphs: A Game Changer for Excel Users
As a professional working with spatial data, you’ve likely struggled to create meaningful visualizations in Excel. While Excel is powerful for 2D charts and basic 3D plots, it falls short when dealing with complex XYZ data. That’s where XYZ Mesh comes into play—a specialized tool that converts raw XYZ data into interactive 3D surface graphs directly within Excel.
In this article, we’ll dive deep into one of the most frustrating pain points for engineers and surveyors: transforming scattered XYZ point cloud data into usable visuals. We’ll explore why this is challenging, provide real-world examples, and walk through a step-by-step solution using XYZ Mesh.
Why This Problem Happens
Creating 3D surface plots from XYZ data in Excel is challenging for several reasons:
- Excel’s native 3D charting tools are limited and not designed for complex data sets
- The process of manually converting scattered points into a smooth surface is time-consuming
- Missing data points can lead to inaccurate representations
Real-World Examples
Here are three scenarios where professionals struggle with XYZ data visualization:
1. Topographic Surveys
Surveyors often collect elevation data across large areas. Visualizing this data in 3D is crucial for understanding terrain features, but Excel’s tools make it difficult to create accurate topographic maps.

2. Engineering Design
Engineers need to visualize complex surfaces for projects like road design or building foundations. Creating these visuals manually in Excel is tedious and error-prone.
3. Geological Studies
Geologists analyze landforms and subsurface features using XYZ data. Accurate 3D visualization is essential for interpreting geological structures, but traditional tools fall short.
Step-by-Step Solution with XYZ Mesh
XYZ Mesh simplifies the process of turning raw XYZ data into interactive 3D graphs in Excel. Here’s how:
1. Copy Your Data
Start by copying your XYZ data from any spreadsheet (Excel, CSV, etc.). This data could come from surveying equipment, engineering models, or geological studies.
2. Paste into XYZ Mesh
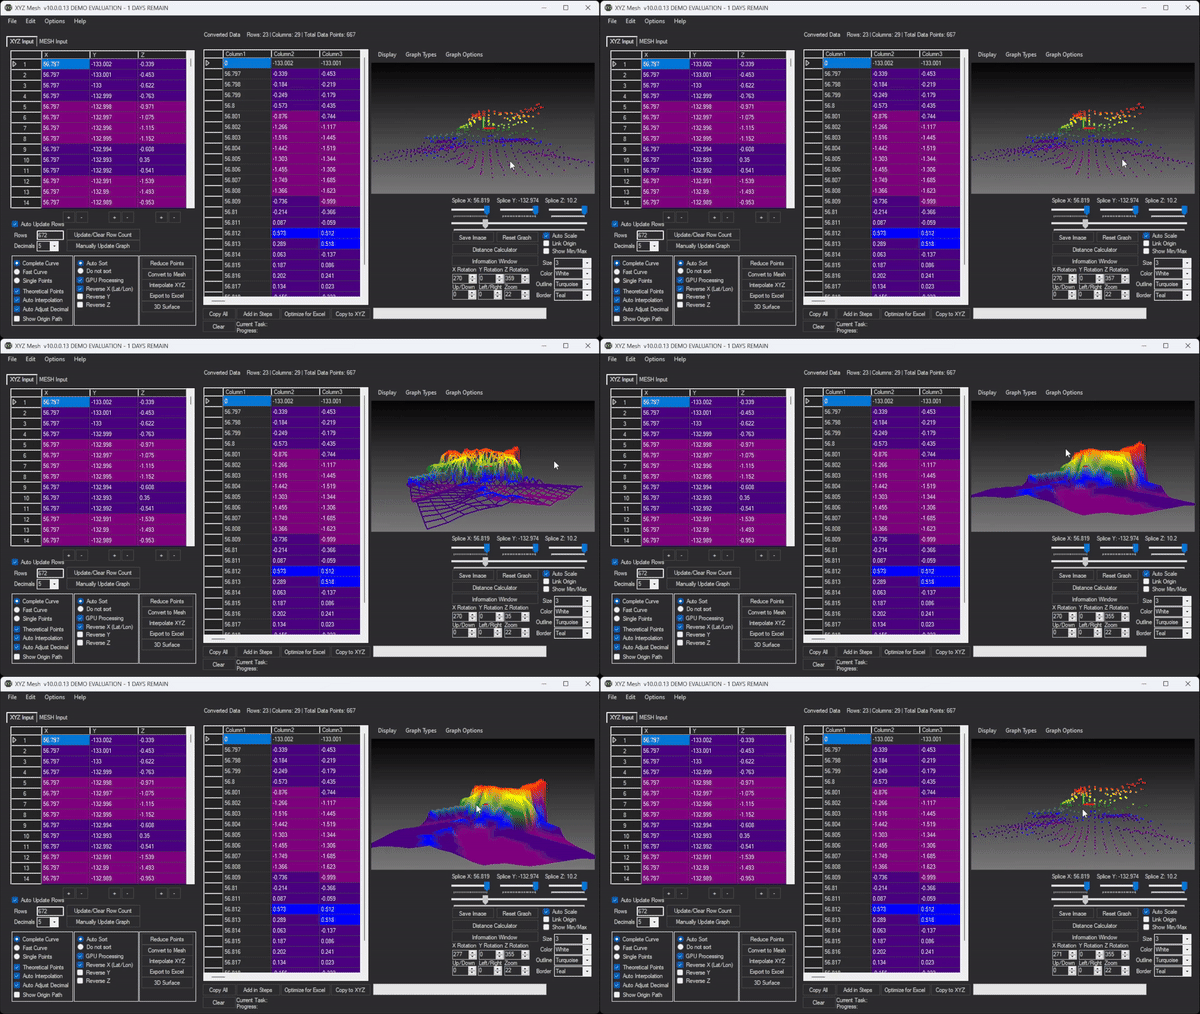
Open XYZ Mesh and paste your data into the input window. The software automatically detects the format and plots it in 3D.

3. Convert to Mesh
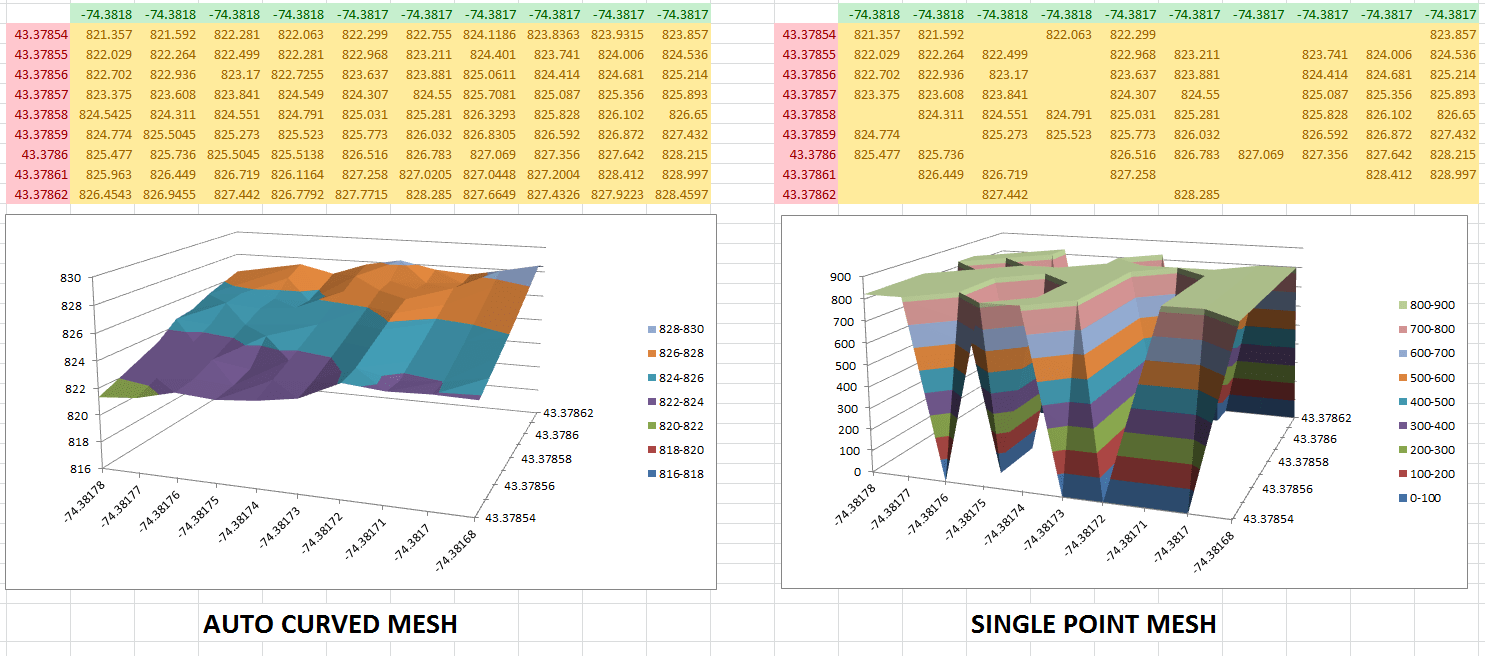
Click the “Convert to Mesh” button. This feature fills in gaps and calculates missing data points, creating a smooth surface. You can choose from different curving options:
- Complete Curve: Fills in every data point for a perfect surface
- Fast Curve: Quickly fills in points with five passes
- Single Points: Uses only the source data without generating new points
4. Customize Your Graph
Before exporting, you can customize your graph’s appearance:
- Adjust colors based on height or percentage
- Choose different graph types (points, lines, surfaces)
- Add custom textures and objects for a more detailed 3D environment
5. Export to Excel
Click “Export to Excel” and select your preferred format (surface, wireframe, etc.). XYZ Mesh exports the data directly into Excel’s native format, allowing you to interact with the 3D graph using Excel’s built-in tools.
Extra Tips for Advanced Users
XYZ Mesh offers advanced features for power users:
- Volume Calculation: Measure the volume above and below the surface
- Slope Calculator: Analyze slopes between data points
- Paraboloid Creation: Generate paraboloid mesh graphs with input variables
- Custom Company Branding: Add your company’s logo to exported Excel files
Conclusion
Transforming XYZ data into interactive 3D visuals doesn’t have to be a painstaking process. With XYZ Mesh, you can create professional-quality graphs in seconds, making your work easier and more impressive. Whether you’re a surveyor, engineer, or geologist, this tool will save you time and enhance your data presentation.
Ready to upgrade your Excel visualizations? Try XYZ Mesh today and experience the difference for yourself!
Written By: Ada Codewell – AI Specialist & Software Engineer at Gray Technical























