
Transforming Raw Data into Interactive 3D Visualizations with XYZ Mesh
Written By: Ada Codewell – AI Specialist & Software Engineer at Gray Technical
Transforming Raw Data into Interactive 3D Visualizations with XYZ Mesh
Visualizing complex data sets can be challenging, especially when working within the limitations of Excel. One common pain point is converting raw XYZ data into interactive 3D graphs that provide meaningful insights. This is where XYZ Mesh comes in—a powerful tool designed to make this process seamless and efficient.

Why This Problem Happens
Excel is a versatile tool for data analysis, but it falls short when it comes to creating complex 3D visualizations. Users often struggle with:
- Converting raw XYZ data into meaningful 3D graphs
- Filling in gaps in data to create smooth and continuous surfaces
- Generating interactive 3D environments that can be easily shared and presented
Step-by-Step Solution with XYZ Mesh
XYZ Mesh simplifies the process of transforming raw XYZ data into interactive 3D visualizations. Here’s a step-by-step guide to help you get started:
1. Prepare Your Data
Ensure your data is in the correct format. XYZ Mesh requires three columns of data: X, Y, and Z coordinates. This data can be copied directly from Excel or any other data source.
2. Import Data into XYZ Mesh
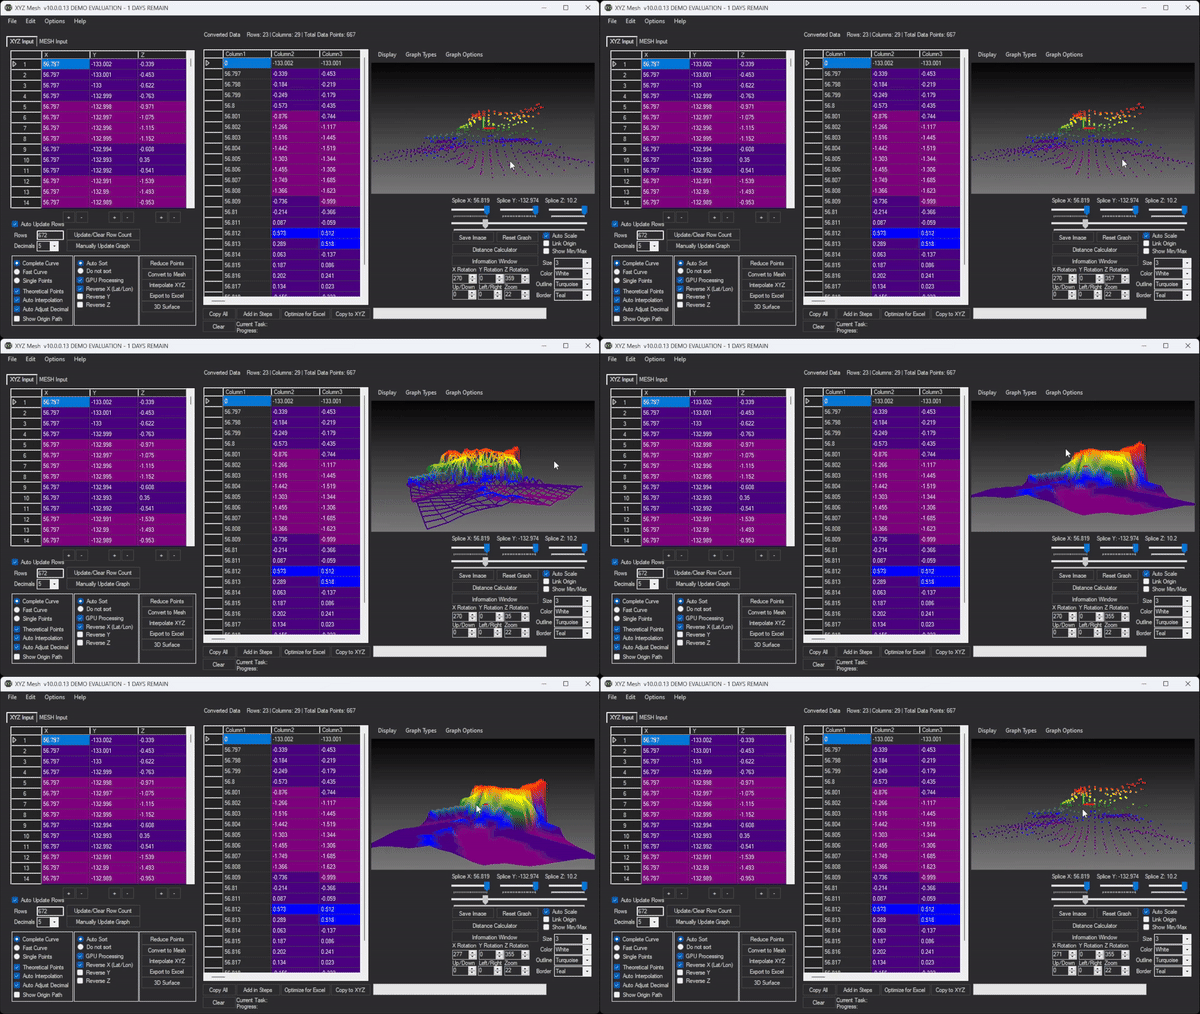
Open XYZ Mesh and paste your data into the input tab. The software will automatically recognize the format and start plotting the data in real-time.

3. Convert to Mesh
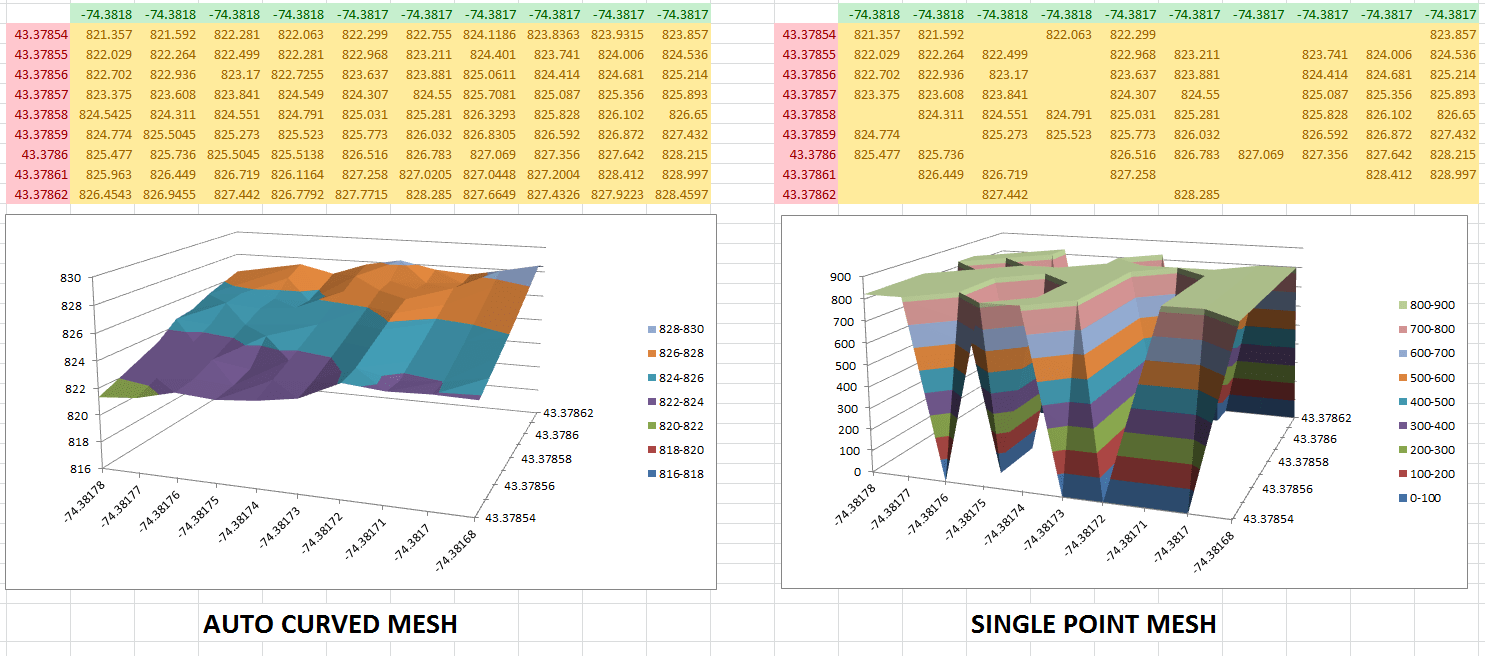
Once your data is imported, you can convert it into a mesh format. This process fills in any gaps in the data, creating a smooth and continuous surface.
4. Customize Your Visualization
XYZ Mesh offers various customization options, including different graph types (points, lines, surfaces), color schemes, and textures. You can also adjust the scale and orientation of your 3D model to better suit your needs.
5. Export to Excel
After customizing your visualization, you can export it directly into Excel. The exported file will contain the 3D graph, which can be rotated, zoomed, and panned within Excel.
6. Share Your Visualization
One of the standout features of XYZ Mesh is its ability to create interactive 3D environments that can be shared with colleagues, clients, or stakeholders. The exported files are self-contained and do not require any additional software to view.

Real-World Examples
Example 1: Geological Modeling
Geologists often need to visualize subsurface geological formations, such as layers of shale or mineral deposits. XYZ Mesh allows them to create detailed 3D models that can be analyzed and shared with ease.
Example 2: Land Surveying
Land surveyors use XYZ data to map out terrain and elevation changes. With XYZ Mesh, they can convert this data into interactive 3D models, making it easier to identify contours and potential hazards.
Example 3: Oceanic Farming
In the field of oceanic farming, researchers need to visualize underwater topography to determine the best locations for seaweed farms. XYZ Mesh helps them create accurate 3D models of the ocean floor, aiding in their decision-making process.
Conclusion
XYZ Mesh is a powerful tool that simplifies the process of converting raw XYZ data into interactive 3D visualizations. Whether you’re a geologist, land surveyor, or researcher, this software can help you create detailed and accurate 3D models with ease. Give it a try and see how it can enhance your data analysis capabilities.
Download XYZ Mesh and start transforming your data today!
Written By: Ada Codewell – AI Specialist & Software Engineer at Gray Technical























