Transform Your XYZ Data into Interactive 3D Graphs Directly in Excel
Written By: Ada Codewell – AI Specialist & Software Engineer at Gray Technical
Transform Your XYZ Data into Interactive 3D Graphs Directly in Excel
If you’re grappling with the challenges of visualizing complex XYZ data sets, you know how frustrating it can be. Traditional methods often fall short when it comes to presenting multidimensional data in a clear and interactive manner, especially within the familiar environment of Microsoft Excel. This is where XYZ Mesh comes into play.
![]()
Why This Problem Happens
Visualizing XYZ data in Excel can be particularly challenging because Excel is not inherently designed for complex 3D visualizations. While it can create basic charts, the limitations become apparent when you need to work with detailed 3D models and interactive graphs. Traditional methods often require exporting data to specialized software, which can be cumbersome and may result in loss of data integrity.
Moreover, many professionals lack the programming skills needed to implement custom solutions, leaving them dependent on trial-and-error approaches or expensive enterprise tools.
The XYZ Mesh Solution
XYZ Mesh is a game-changer for professionals seeking to convert raw XYZ data into interactive 3D graphs directly within Excel. This tool bridges the gap between simple spreadsheet software and advanced 3D visualization needs.

Step-by-Step Solution
Here’s how you can use XYZ Mesh to convert your XYZ data into stunning 3D visuals:
- Start by downloading and installing XYZ Mesh. A free trial is available for evaluation.
- Copy your XYZ data from your source (e.g., a CSV file or another spreadsheet) and paste it into the XYZ input tab of XYZ Mesh.
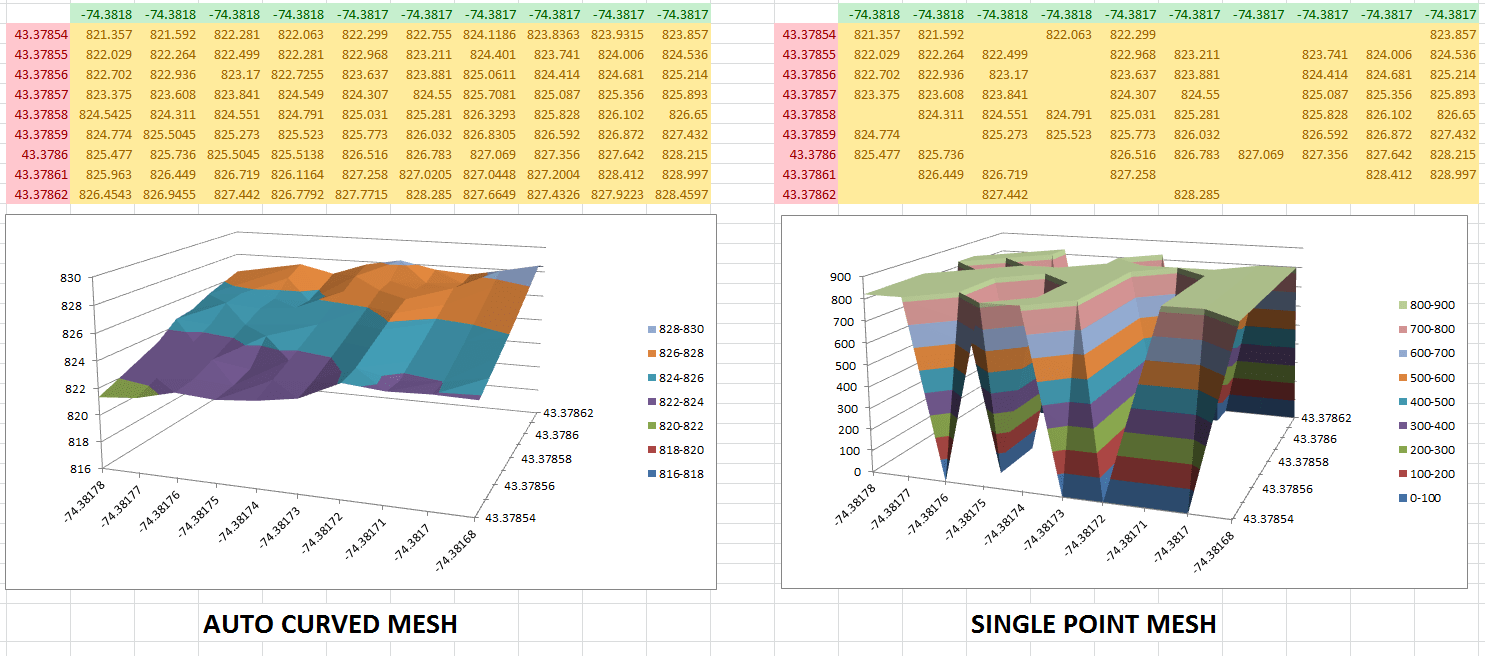
- Watch as XYZ Mesh automatically updates the graph with your data. Adjust decimals, reduce points if necessary, and use interpolation to fill in any gaps in your data.
- Choose from various graphing options such as 3D Surface Model, Wireframe, or Scatter Plot. Customize colors, textures, and other visual elements to best represent your data.
- Export the completed 3D graph directly into Excel. The exported file will be interactive, allowing viewers to rotate, zoom, and pan the 3D model.
Real-World Examples
Let’s explore some real-world examples where XYZ Mesh has made a significant impact:
Example 1: Geological Modeling
In geological studies, understanding subsurface formations is crucial. By using XYZ Mesh, geologists can visualize layers of shale or mineral deposits in 3D. This allows for more accurate analysis and better decision-making.
Example 2: Oceanic Farming
Oceanic farmers use XYZ Mesh to map out underwater terrains and currents. This helps in optimizing the placement of seaweed farms and other aquatic crops, leading to higher yields.
Example 3: Conservationist Efforts
Conservationists use XYZ Mesh to create detailed maps of habitats. These visualizations help in tracking environmental changes and planning conservation efforts more effectively.
Advanced Tips and Tricks
To get the most out of XYZ Mesh, consider these advanced tips:
Custom Coloring and Texturing
Make use of custom coloring options to highlight specific data points or ranges. You can also add textures to your 3D models for a more realistic representation.
Volume and Slope Calculations
XYZ Mesh allows you to calculate volumes above and below surfaces, as well as slopes between points. These calculations can be crucial for detailed analysis.
Conclusion
XYZ Mesh is a powerful tool that makes it easy to visualize complex XYZ data directly within Excel. Its user-friendly interface and robust features make it an invaluable asset for professionals across various fields.
Whether you’re working in geology, oceanic farming, or conservation, XYZ Mesh provides the visual clarity you need to make informed decisions. Try it today and see how it can transform your data visualization efforts!
Written By: Ada Codewell – AI Specialist & Software Engineer


