Transforming XYZ Data into Interactive 3D Graphs: A Game Changer for Excel Users
Written By: Ada Codewell – AI Specialist & Software Engineer at Gray Technical
Transforming XYZ Data into Interactive 3D Graphs: A Game Changer for Excel Users
Written By: Ada Codewell – AI Specialist & Software Engineer at Gray Technical
In the world of data visualization, transforming raw XYZ data into interactive 3D graphs can be a challenging task. Microsoft Excel, while powerful, has its limitations when it comes to handling complex 3D graphing needs. Enter XYZ Mesh, a tool designed to bridge this gap and make 3D graphing in Excel as easy as a few clicks.


Why This Problem Happens
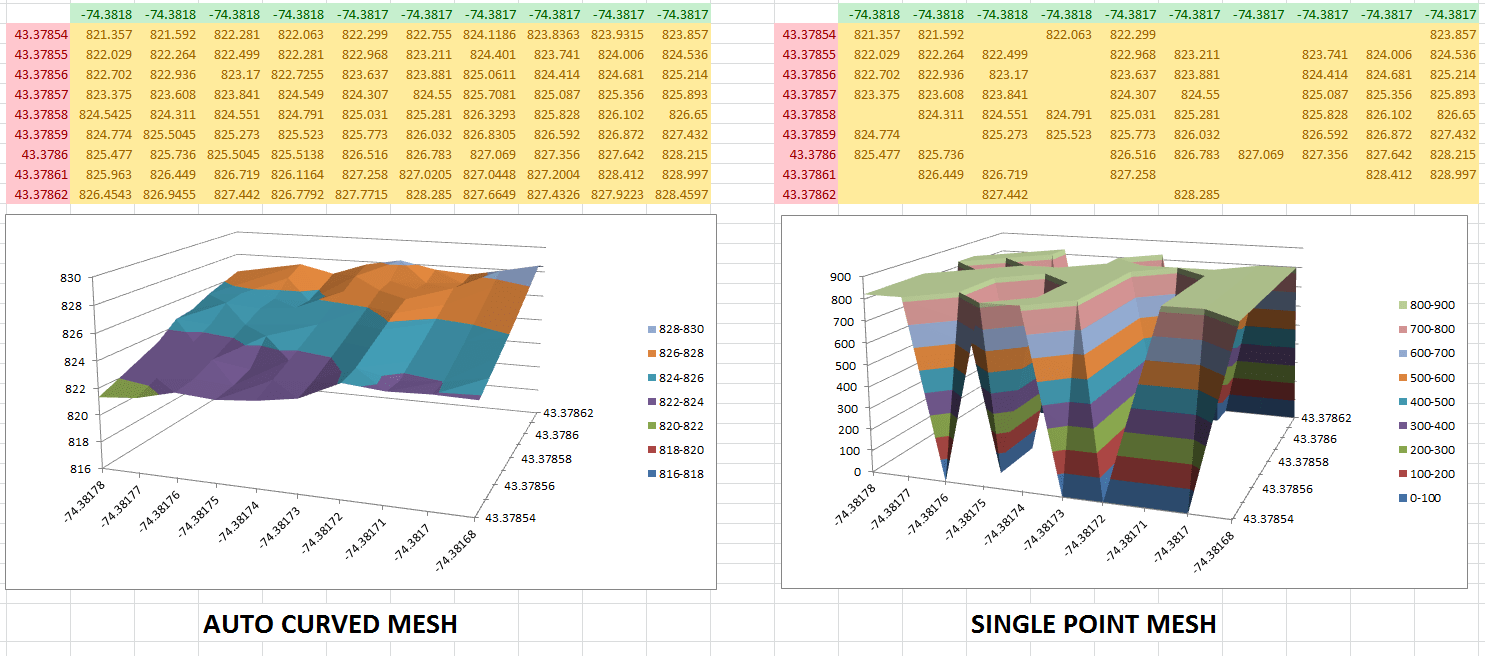
When you work with XYZ data, it often represents spatial information in three dimensions. Excel is great for many things, but creating interactive 3D graphs is not one of its strong suits. Standard Excel functionalities either don’t support complex 3D rendering or require extensive manual setup, which can be time-consuming and prone to errors.
Real-World Examples
Let’s explore some real-world scenarios where XYZ Mesh excels:
Geological Surveys
In geology, mapping subsurface formations is crucial. Traditional methods involve complex software that requires specialized knowledge. With XYZ Mesh, geologists can quickly import their XYZ data into Excel and generate 3D surface models with just a few clicks.

Environmental Monitoring
For environmental scientists monitoring pollution levels or tracking changes in topography over time, XYZ Mesh can create dynamic 3D scatter plots that reveal patterns and trends. These visualizations help stakeholders understand the data better without needing advanced technical skills.
Urban Planning
City planners need to visualize proposed changes in elevation or the impact of new structures. XYZ Mesh can import data from various sources and create interactive 3D models, allowing planners to rotate, zoom, and pan through their designs directly within Excel.
Step-by-Step Solution with XYZ Mesh
Here’s a step-by-step guide to transforming your XYZ data into interactive 3D graphs using XYZ Mesh:
Step 1: Install XYZ Mesh
First, download and install XYZ Mesh from the official website. The tool is compatible with various versions of Microsoft Excel, ensuring a smooth integration process.
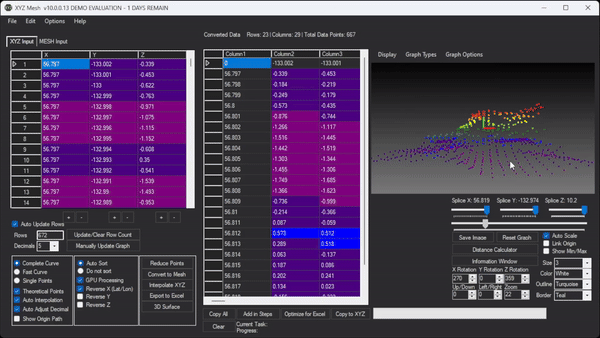
Step 2: Import Your XYZ Data
Open XYZ Mesh and paste your XYZ data into the designated input tab. The software will automatically update the graph in real-time as you input your data.
Step 3: Convert to MESH or Interpolate
Choose whether you want to convert your data into a MESH format or interpolate the data points. This step ensures that any gaps in your data are filled, providing a complete and accurate representation.
Step 4: Customize Your Graph
Use the various customization options available in XYZ Mesh to adjust colors, apply shading effects, and select graph types such as surface, scatter plots, or wireframes. You can also reverse axes or apply custom textures to your models.
Step 5: Export to Excel
Once you’re satisfied with your 3D model, export it directly into Excel. The exported file will contain all the data and interactive features, allowing anyone with access to view and manipulate the graph as needed.

Extra Tip: Enhance Interactivity
For an even more immersive experience, use XYZ Mesh’s interactive rendering capabilities. This feature allows you to create a virtual environment where users can traverse the terrain with standard WASD and mouse controls. It’s ideal for presentations or demonstrations where you want to showcase your data in a dynamic way.
Conclusion
XYZ Mesh is a game-changer for anyone looking to transform raw XYZ data into interactive 3D graphs within Excel. It simplifies the process, making it accessible even to those without advanced technical skills. Whether you’re in geology, environmental science, or urban planning, this tool can save you time and provide powerful visualizations that make your data come alive.
Try out XYZ Mesh today and see how it can transform your data visualization efforts!


