Transforming Raw XYZ Data into Interactive 3D Graphs with XYZ Mesh
Written By: Ada Codewell – AI Specialist & Software Engineer at Gray Technical
Transforming Raw XYZ Data into Interactive 3D Graphs with XYZ Mesh
When working with raw XYZ data, creating meaningful visualizations can be challenging. Excel has limited capabilities for handling 3D graphs, and many specialized tools are either too expensive or complex to use effectively. This is where XYZ Mesh comes in—a game-changer for turning raw XYZ data into interactive 3D graphs directly within Excel.
![]()
Why This Problem Happens
Excel is a powerful tool for data analysis, but it struggles with complex 3D graphing. Traditional Excel charts are limited to basic 2D plots, and while 3D chart options do exist, they are clunky, difficult to manipulate, and often lack the interactivity needed for in-depth analysis. This limitation is a significant barrier for professionals who need to visualize complex data sets like geological formations, land surveys, or scientific research.
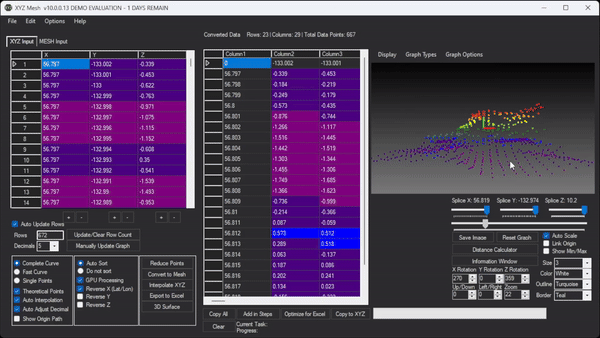
Step-by-Step Solution with XYZ Mesh
XYZ Mesh solves this problem by providing a seamless way to convert raw XYZ data into interactive 3D visualizations. Here’s how you can do it:
1. Install and Open XYZ Mesh
First, download XYZ Mesh from the official website and install it on your computer. Once installed, open the application.
2. Input Your Data
Copy your raw XYZ data from Excel or any other source and paste it into the XYZ input tab in XYZ Mesh.
3. Convert to MESH
Click on the “Convert to Mesh” button to transform your raw XYZ data into a format that can be visualized in 3D.
4. Customize Your Graph
Use XYZ Mesh’s customization options to adjust colors, scaling, and other visual parameters to suit your needs. You can choose from various graph types like surface, wireframe, or scatter plots.
5. Export to Excel
Once you’re satisfied with your 3D visualization, click on the “Export to Excel” button. XYZ Mesh will generate an interactive 3D graph that can be embedded directly into an Excel worksheet.
Extra Tip: Adding Interactivity
One of the standout features of XYZ Mesh is its ability to create interactive 3D environments. You can add textures, paths, and even assets like trees or rocks to your 3D models. This interactivity allows you to immerse yourself in the data, exploring it from different angles and perspectives.

Real-World Examples
Let’s look at some practical examples where XYZ Mesh has made a significant difference:
Example 1: Geological Surveying
Geologists often need to visualize subsurface formations. With XYZ Mesh, they can take raw survey data and create detailed 3D models that help them understand the distribution of minerals or the structure of rock layers.
Example 2: Oceanic Farming
In oceanic farming, monitoring the growth and health of seaweed or other marine crops is crucial. XYZ Mesh allows farmers to visualize data from sensors placed in the water, helping them optimize growing conditions.
Example 3: Conservation Efforts
Conservationists use XYZ Mesh to map out landforms and track changes over time. This helps them monitor erosion, deforestation, or other environmental impacts.
Conclusion
XYZ Mesh is a powerful tool that bridges the gap between raw data and meaningful visualizations. Its ability to create interactive 3D graphs directly in Excel makes it an invaluable asset for professionals across various fields. Whether you’re a geologist, oceanographer, or conservationist, XYZ Mesh can help you turn complex data into intuitive visuals.
To experience the benefits of XYZ Mesh for yourself, download the free trial today and start transforming your raw XYZ data into interactive 3D graphs.
Written By: Ada Codewell – AI Specialist & Software Engineer


