Transforming Raw XYZ Data into Interactive 3D Graphs in Excel: A Game Changer
Written By: Ada Codewell – AI Specialist & Software Engineer at Gray Technical
Transforming Raw XYZ Data into Interactive 3D Graphs in Excel: A Game Changer
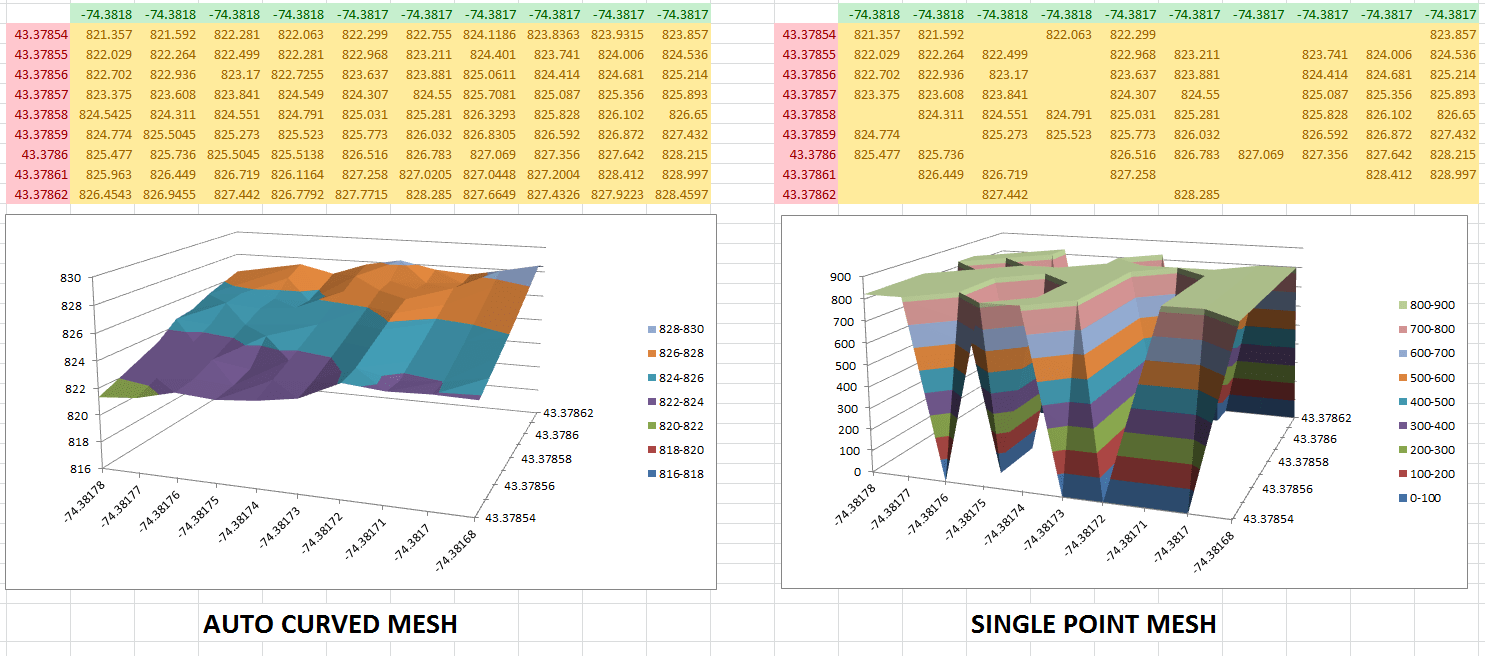
Are you struggling to visualize raw XYZ data effectively? Excel’s built-in charting capabilities can fall short when it comes to complex 3D visualizations, leading to time-consuming and frustrating efforts. Enter XYZ Mesh – a powerful tool designed specifically for converting XYZ data into interactive 3D graphs directly within Excel.
![]()
Why Visualizing XYZ Data is a Challenge
Visualizing XYZ data accurately in Excel can be particularly challenging for several reasons:
- Excel’s standard charting tools are not designed to handle complex 3D visualizations.
- Creating interactive 3D graphs manually involves extensive coding and time-consuming adjustments.
- The native tools often fail to provide the level of detail and interactivity needed for comprehensive data analysis.
These limitations can significantly hinder your ability to present data in a compelling way, especially when dealing with complex geological, topographical, or scientific datasets.
Real-World Examples: Where XYZ Mesh Makes a Difference
Let’s look at three real-world scenarios where XYZ Mesh can make a significant impact:
Example 1: Geological Surveying
Geologists often need to visualize subsurface geological formations such as layers of shale, mineral deposits, or other underground structures. With XYZ Mesh, they can convert XYZ data points into interactive 3D surface graphs that reveal the depth and distribution of these features. This allows for more accurate analysis and better decision-making in field operations.
Example 2: Topographical Mapping
In land surveying, creating detailed topographical maps requires precise visualization of elevation data. XYZ Mesh enables surveyors to import XYZ coordinates and generate 3D scatter plots that can be rotated, zoomed, and panned within Excel, providing a dynamic view of the terrain.
Example 3: Oceanographic Research
Oceanographers studying seabed topography use XYZ Mesh to visualize bathymetric data. The software’s ability to create detailed 3D surface models helps researchers understand the underwater landscape better, aiding in studies related to marine life habitats and seafloor geology.
Step-by-Step Solution: Using XYZ Mesh to Create Interactive 3D Graphs
Let’s go through the process of converting raw XYZ data into interactive 3D graphs using XYZ Mesh.
Step 1: Install and Open XYZ Mesh
Download and install XYZ Mesh. Open the application to start a new project.

Step 2: Import Your XYZ Data
Copy your XYZ data from your data source and paste it into the XYZ input tab within XYZ Mesh. The software will automatically update the graph on the right side of the interface.
Step 3: Customize Your Graph
Use the options available in XYZ Mesh to customize your graph. You can choose different graph types (e.g., points, lines, surface) and adjust settings like color schemes, shading effects, and point sizes. XYZ Mesh also allows you to reverse axis if needed for specific applications like Lat/Long mapping.
Step 4: Export to Excel
Once your graph is ready, click on ‘Export to Excel’ and select the type of graph you want to export (e.g., 3D scatter plot, surface graph). XYZ Mesh will generate an Excel file containing your 3D graph, which can be shared with colleagues or clients.
Extra Tip: Advanced Interactivity with 3D Rendering
XYZ Mesh also offers advanced interactivity through its 3D rendering feature. This allows you to create immersive 3D environments where users can traverse the terrain using standard WASD and mouse controls. You can add assets like trees, rocks, and paths to make your visualizations even more engaging.
Conclusion
Visualizing XYZ data effectively in Excel no longer has to be a daunting task. With XYZ Mesh, you can transform raw XYZ data into interactive 3D graphs with just a few clicks, making your data analysis more accurate and your presentations more compelling. Try it out today to see the difference for yourself!
Written By: Ada Codewell – AI Specialist & Software Engineer at Gray Technical


