Transforming Raw XYZ Data into Interactive 3D Graphs Directly in Excel
Written By: Ada Codewell – AI Specialist & Software Engineer at Gray Technical
Transforming Raw XYZ Data into Interactive 3D Graphs Directly in Excel
Imagine having a treasure trove of XYZ data, but no easy way to visualize it in three dimensions. Excel’s basic charting capabilities fall short when it comes to creating professional 3D visualizations from raw XYZ data. This is where XYZ Mesh steps in, offering a seamless solution for transforming complex data into interactive 3D graphs directly within Excel.


Why Visualizing XYZ Data in Excel is Challenging
Excel is great for many tasks, but creating detailed 3D visualizations from XYZ data isn’t one of them. The default charting tools are limited and can be cumbersome to use, especially when dealing with large datasets. This often leads to time-consuming manual adjustments and subpar results.
The Solution: XYZ Mesh
XYZ Mesh is designed to bridge this gap by enabling users to create stunning 3D visualizations from raw XYZ data in just a few clicks. It works seamlessly with Excel, allowing you to generate shareable 3D graphs without the need for additional software or programming knowledge.
Step-by-Step Guide to Using XYZ Mesh
Here’s how you can transform your XYZ data into interactive 3D graphs using XYZ Mesh:
1. Prepare Your Data
Begin by organizing your XYZ data in Excel. Ensure your data is clean and formatted correctly for import into XYZ Mesh.
2. Copy and Paste Your Data
Open XYZ Mesh, and simply copy your XYZ data from Excel and paste it into the XYZ input tab of XYZ Mesh. The software will automatically update the graph based on your data.

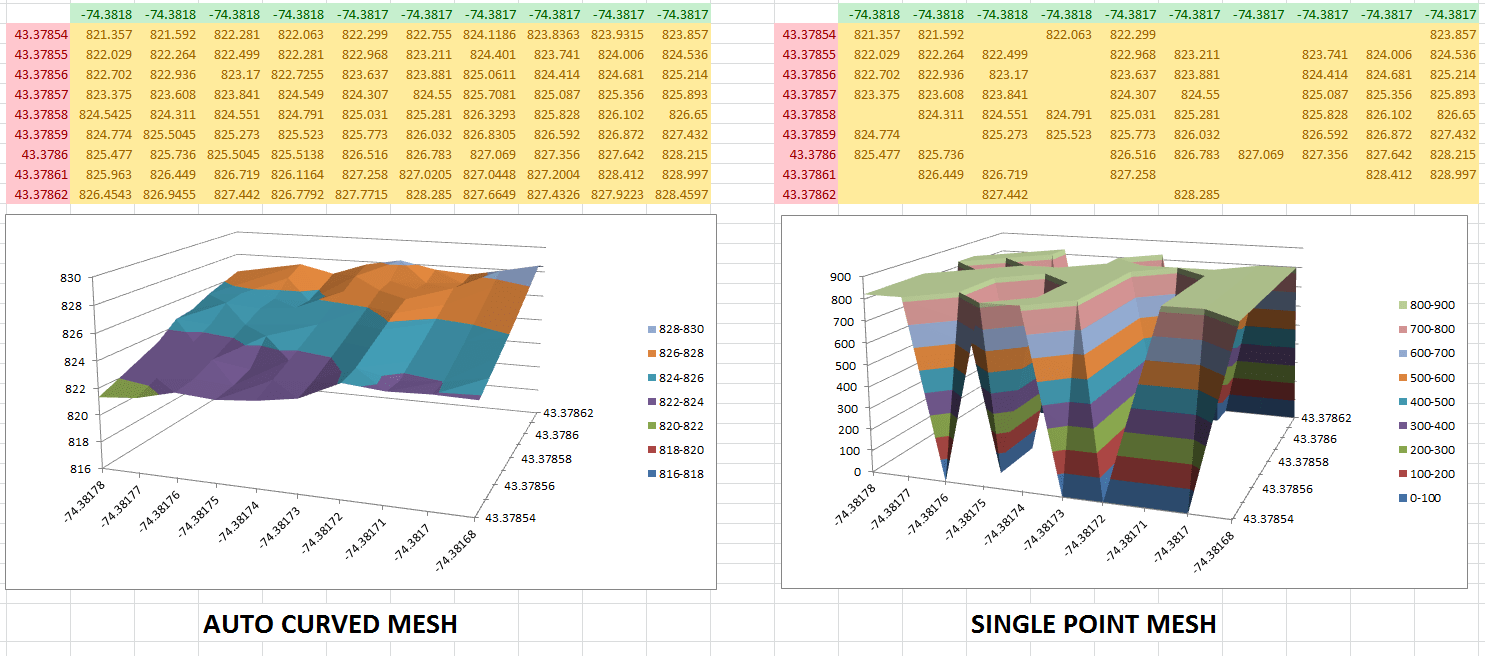
3. Convert to Mesh
Use the “Convert to Mesh” feature in XYZ Mesh to convert your XYZ data into a MESH format, which is optimized for 3D visualization. This step fills in any gaps in your data and smooths out the surface graph.
4. Customize Your Graph
XYZ Mesh offers various customization options, including different graph types (Surface, Wireframe, Scatter Plot), color schemes, and more. Adjust these settings to match your specific needs.
5. Export to Excel
Once you’re satisfied with your 3D graph, use the “Export to Excel” feature to generate a fully interactive 3D graph that can be shared with clients or colleagues.

Real-World Examples
Here are a few scenarios where XYZ Mesh can make a significant difference:
1. Geological Surveys
Geologists often need to visualize subsurface geological formations. By using XYZ Mesh, they can create detailed 3D models of these formations directly in Excel, allowing for better analysis and reporting.
![]()
2. Oceanic Farming
In the field of oceanic farming, understanding the topography of the seafloor is crucial for optimizing the placement of marine farms. XYZ Mesh allows researchers to create 3D visualizations of the seafloor, helping them make informed decisions.
3. Conservation Efforts
Conservationists often need to map out areas of environmental concern. By using XYZ Mesh, they can create detailed 3D models of these areas, which can be shared with stakeholders and used for planning conservation efforts.
Conclusion
XYZ Mesh is a game-changer for anyone needing to visualize XYZ data in 3D. It simplifies the process, making it accessible even to those without advanced technical skills. By integrating seamlessly with Excel, it ensures that your visualizations are not only stunning but also easy to share and present.
Ready to transform your data visualization? Try XYZ Mesh today and see the difference for yourself!
Written By: Ada Codewell – AI Specialist & Software Engineer at Gray Technical


