
Transforming Data Visualization: How XYZ Mesh Solves Excel’s 3D Graph Challenges
Written By: Ada Codewell – AI Specialist & Software Engineer at Gray Technical
Transforming Data Visualization: How XYZ Mesh Solves Excel’s 3D Graph Challenges
If you’ve ever struggled to create compelling 3D surface plots in Excel, you’re not alone. Excel is a powerful tool, but when it comes to 3D data visualization, its built-in charting capabilities fall short, leaving many professionals frustrated. Enter XYZ Mesh, the game-changing solution that turns raw XYZ data into stunning interactive 3D graphs directly within Excel.
XYZ Mesh offers an elegant and efficient way to convert complex datasets into professional-grade visuals, filling a significant gap in Excel’s functionality. Whether you’re a surveyor, engineer, geologist, or researcher, this tool can streamline your workflow and enhance your presentations with ease.

Why 3D Graphing in Excel is Difficult
Creating accurate and visually appealing 3D graphs in Excel is challenging due to several limitations:
- Excel’s default 3D chart types are clunky and not user-friendly.
- The software struggles with large datasets, often resulting in slow performance or crashes.
- Customizing 3D charts to reflect specific data nuances is complex and time-consuming.
These limitations can hinder your ability to effectively communicate data insights. XYZ Mesh addresses these issues by providing a seamless way to transform raw XYZ point cloud data into interactive 3D visualizations that are easy to understand and share.
The Solution: XYZ Mesh
XYZ Mesh is designed specifically for professionals who need to visualize complex datasets without the hassle. This software converts XYZ data directly into professional-grade 3D visuals, animations, and shareable plots in seconds. It’s a straightforward, copy-and-paste solution that works seamlessly within Excel.
Here’s how it works:
- Copy your XYZ data from Excel, CSV, or any spreadsheet.
- Paste the data into XYZ Mesh, which automatically detects the format and plots it in 3D.
- Export to Excel, create interactive 3D models, or export to KML/DXF.

Real-World Examples
To illustrate the power of XYZ Mesh, let’s look at three practical scenarios where this tool shines:
Example 1: Topographical Mapping for Surveyors
Surveyors often need to create detailed topographical maps that accurately represent terrain features. With traditional Excel charts, capturing the nuances of elevation changes and surface contours is difficult.
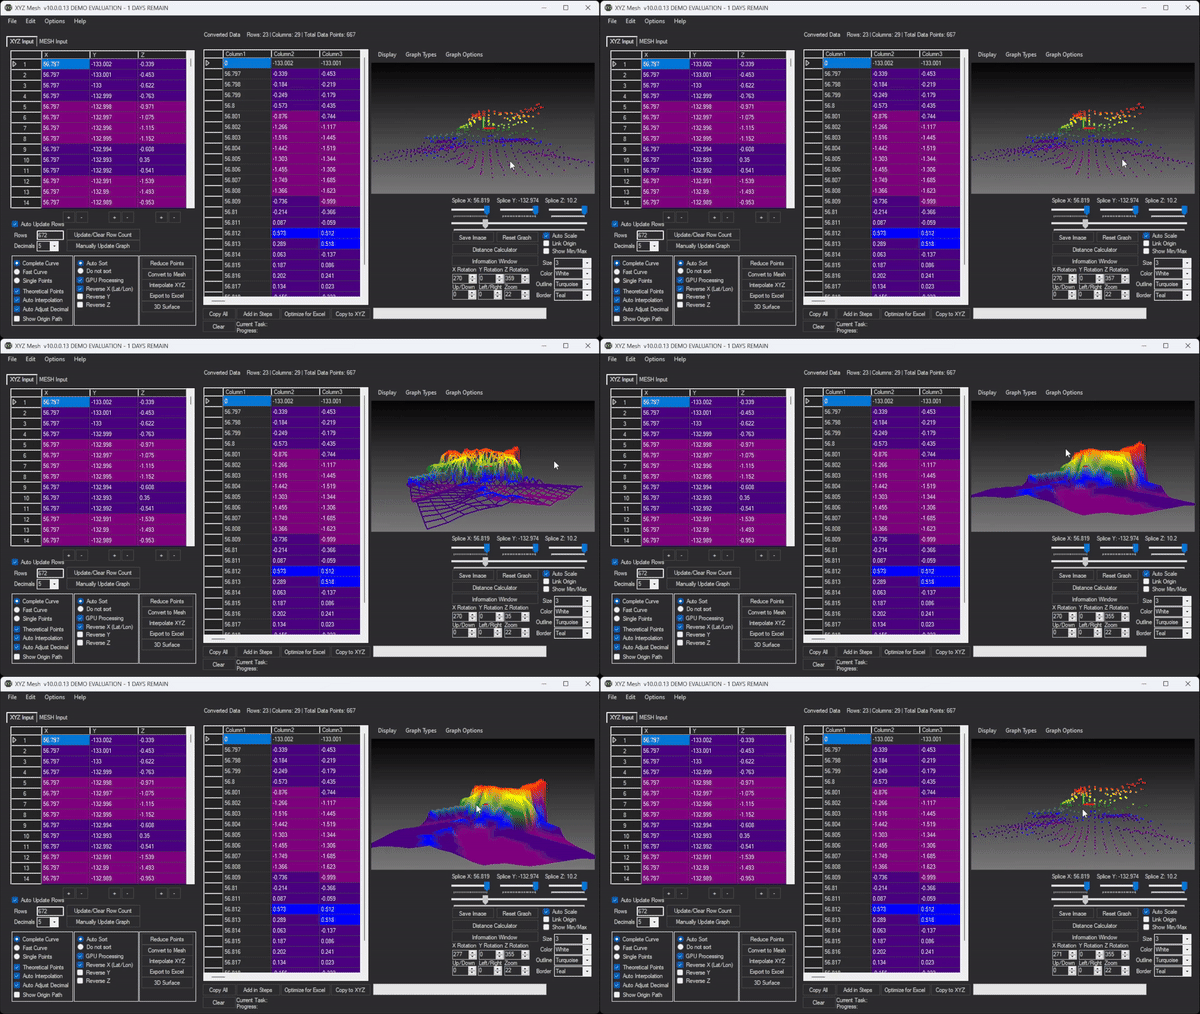
XYZ Mesh simplifies this process by converting survey data into 3D surface graphs with just a few clicks. The result is a highly detailed and interactive map that surveyors can use to communicate findings to clients or stakeholders.
Example 2: Engineering Data Visualization
Engineers frequently need to visualize structural data, stress analysis results, or other complex datasets. Excel’s default charts can’t handle the intricacies of these datasets, leading to inaccurate representations.
With XYZ Mesh, engineers can create precise 3D surface plots that accurately depict their data. The ability to interact with the graphs—zooming, rotating, and panning—provides deeper insights into the data’s characteristics.
Example 3: Geological Analysis
Geologists study rock formations, soil layers, and other geological features. Visualizing these features in 3D is crucial for understanding subsurface structures and making informed decisions.
XYZ Mesh allows geologists to convert borehole data or seismic survey results into detailed 3D visualizations, providing a clearer picture of underground formations. The software’s ability to handle large datasets ensures that even the most complex geological models can be accurately represented.
Step-by-Step Guide to Using XYZ Mesh
Using XYZ Mesh is straightforward and intuitive. Here’s a step-by-step guide to get you started:
Step 1: Install and Launch XYZ Mesh
Download XYZ Mesh from the official website. Follow the installation instructions and launch the application.
Step 2: Prepare Your Data
Gather your XYZ data from Excel, CSV files, or any other spreadsheet. Ensure that your data is clean and formatted correctly for easy importing into XYZ Mesh.
Step 3: Import Data into XYZ Mesh
Open XYZ Mesh and paste your data into the input window. The software automatically detects the format and plots it in 3D.
Step 4: Customize Your Graph
Use XYZ Mesh’s customization options to adjust colors, scales, and other visual elements. The software offers a variety of graph types, including surface plots, scatter plots, and wireframe models.
Step 5: Export Your Visualization
Once you’re satisfied with your 3D graph, export it to Excel, KML, or DXF format. XYZ Mesh ensures that the exported file is interactive and easy to share with colleagues or clients.
Advanced Features of XYZ Mesh
XYZ Mesh offers several advanced features that make it a powerful tool for data visualization:
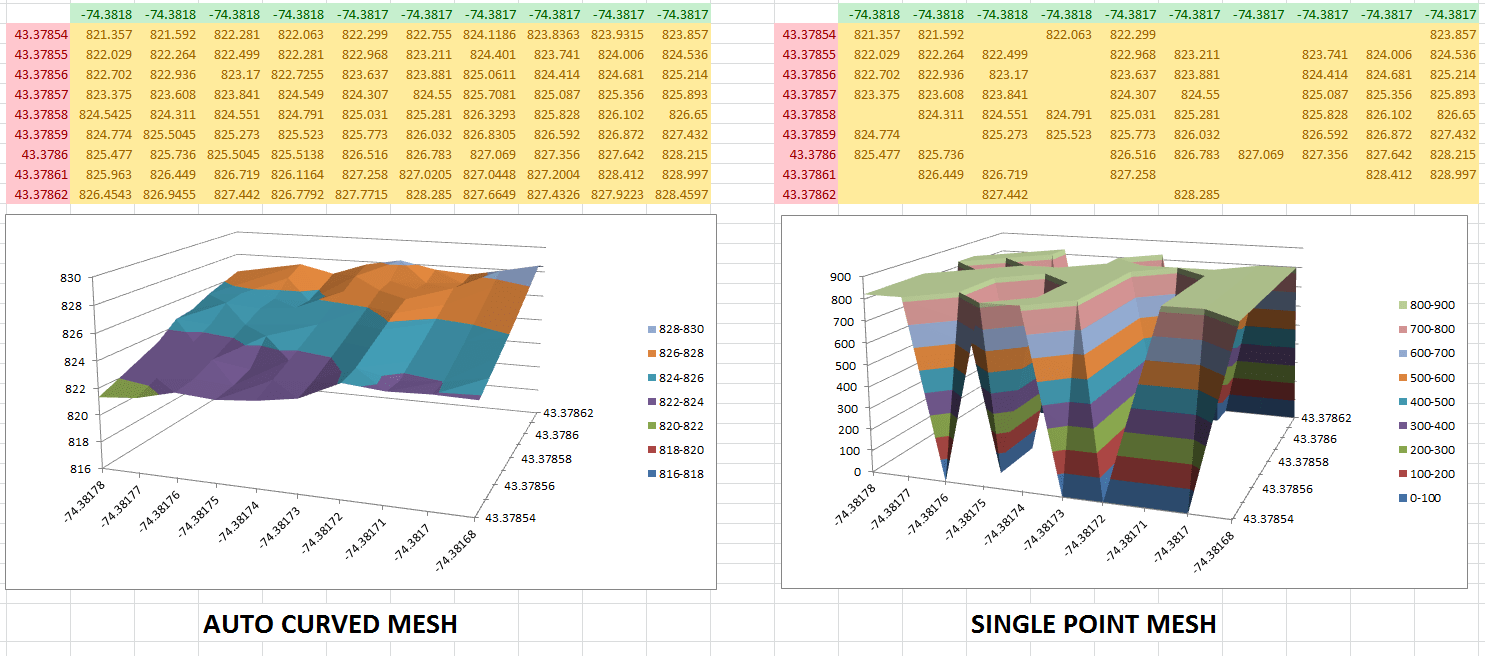
- Theoretical Points: Fills in gaps between data points to create a more accurate representation of the surface.
- Custom Coloring Options: Allows you to set colors based on percentages, custom heights, or specific values.
- Curving Data: Automatically fills missing data points and creates smooth surfaces for professional results.
- Volume Calculation: Calculates the volume above and below the graphed surface based on the highest and lowest Z points.

Conclusion
XYZ Mesh is a game-changer for anyone who needs to visualize complex datasets in Excel. Its ability to convert raw XYZ data into interactive 3D graphs solves a significant pain point for professionals across various industries. With XYZ Mesh, you can create detailed and accurate visualizations that enhance your presentations and streamline your workflow.
Experience the difference for yourself and explore how XYZ Mesh can transform your data visualization needs. Try XYZ Mesh today and elevate your Excel 3D graphing capabilities to the next level.



Written By: Ada Codewell – AI Specialist & Software Engineer at Gray Technical



















