Transform Your XYZ Data into Interactive 3D Graphs with Ease
Written By: Ada Codewell – AI Specialist & Software Engineer at Gray Technical
Transform Your XYZ Data into Interactive 3D Graphs with Ease
Working with XYZ data can be challenging when you need to create interactive 3D visualizations. Traditional methods often require specialized software and extensive programming knowledge, making the process time-consuming and frustrating. Fortunately, there’s a tool that simplifies this entire process: XYZ Mesh.
XYZ Mesh is designed to turn raw XYZ data into interactive 3D graphs directly in Excel, offering professional-grade visualization without the complexity. This tool is particularly useful for fields like geology, land surveying, oceanic farming, and atmospheric analysis. In this article, we’ll explore how XYZ Mesh can solve your visualization challenges and provide step-by-step guidance on using it effectively.
Why is Visualizing XYZ Data So Difficult?
Visualizing XYZ data is complex due to several factors:
- Excel’s limitations with 3D graphing
- The need for specialized software and programming skills
- Time-consuming manual calculations and adjustments
These challenges often result in incomplete or inaccurate visualizations, which can hinder decision-making and data interpretation. XYZ Mesh addresses these issues by providing a user-friendly interface that integrates seamlessly with Excel.
3 Real-World Examples of XYZ Data Visualization Challenges
Example 1: Geological Surveys
Geologists often need to visualize subsurface formations like layers of shale or mineral deposits. Traditional methods involve complex software and manual adjustments, which can be error-prone and time-consuming.

Example 2: Oceanic Farming
Oceanic farmers need to monitor underwater topography to optimize the placement of farming structures. Accurate 3D visualizations are crucial for planning and execution but are difficult to achieve without specialized tools.
Example 3: Atmospheric Analysis
Environmental scientists analyze atmospheric data to study weather patterns and climate change. Creating interactive 3D models of this data is essential for understanding complex relationships but requires advanced visualization tools.
Step-by-Step Solution with XYZ Mesh
XYZ Mesh simplifies the process of creating interactive 3D graphs from XYZ data. Here’s a step-by-step guide to get you started:
Step 1: Install and Open XYZ Mesh
Download and install XYZ Mesh from here. Once installed, open the application and familiarize yourself with the interface.
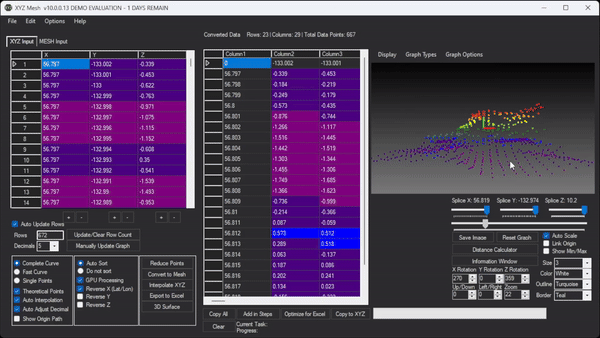
Step 2: Import Your XYZ Data
Copy your XYZ data from your data source (e.g., Excel spreadsheet) and paste it into the XYZ input tab of XYZ Mesh. The data will automatically update in the graphing window.

Step 3: Choose Your Graph Type
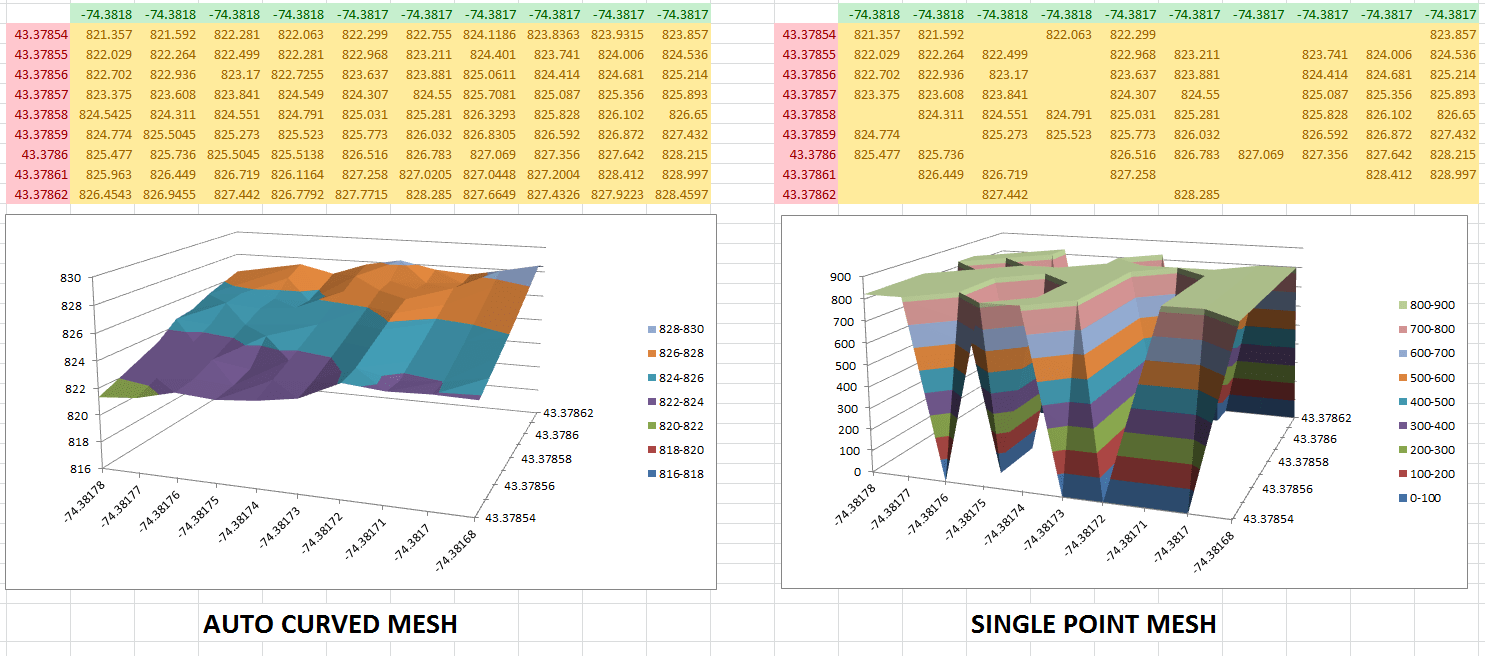
Select the type of graph you want to create from the main menu. Options include Points, Line, Surface, Heat Solid, and more. For most geological data, the Surface or Wireframe options are ideal.
Step 4: Customize Your Graph
Use the customization options to adjust colors, scales, and other visual elements. You can set custom colors based on percentages or values, and even add textures and assets for a more detailed visualization.

Step 5: Export to Excel
Once your graph is customized to your liking, click on ‘Export to Excel.’ This will generate an interactive 3D graph that can be shared with clients or team members. The exported file includes all data and visual elements, ensuring anyone with Excel can view it.
Extra Tip: Enhance Your Visualizations
For more advanced users, XYZ Mesh offers features like custom company branding on Excel exports, paraboloid creation, and 3D model rendering. These tools can significantly enhance the quality and professionalism of your visualizations.
Conclusion
XYZ Mesh is a game-changer for anyone needing to visualize XYZ data. It simplifies the process of creating interactive 3D graphs, making it accessible to professionals across various fields. Whether you’re a geologist, oceanic farmer, or environmental scientist, XYZ Mesh can help you transform your data into compelling visualizations that drive better decision-making.


Ready to elevate your data visualization? Try XYZ Mesh today and experience the difference for yourself.
Written By: Ada Codewell – AI Specialist & Software Engineer


