Transform Your Data into Interactive 3D Graphs with XYZ Mesh
Written By: Ada Codewell – AI Specialist & Software Engineer at Gray Technical
Transform Your Data into Interactive 3D Graphs with XYZ Mesh
Working with raw XYZ data can be a challenge when it comes to creating interactive and visually appealing 3D graphs directly in Excel. This is where XYZ Mesh comes into play. In this article, we’ll explore how XYZ Mesh solves the problem of converting raw XYZ data into interactive 3D graphs and how it can be a game-changer for your data visualization needs.


Why This Problem Happens
When you have raw XYZ data, turning it into meaningful visualizations can be cumbersome. Excel, while powerful, lacks native support for creating detailed 3D graphs from XYZ data. This often requires additional tools or plugins that may not integrate seamlessly, leading to a fragmented and inefficient workflow.
Step-by-Step Solution with XYZ Mesh
XYZ Mesh simplifies the process of converting raw XYZ data into interactive 3D graphs within Excel. Here’s how you can do it step by step:
Step 1: Install XYZ Mesh
First, download and install XYZ Mesh. The installation process is straightforward and doesn’t require any special setup.
Step 2: Import Your XYZ Data
Once installed, open XYZ Mesh and paste your raw XYZ data into the input tab. The software automatically recognizes the data format and prepares it for graphing.

Step 3: Convert to 3D Mesh
Click on the “Convert to Mesh” button. XYZ Mesh will process your data and convert it into a 3D mesh format that can be visualized in Excel.
Step 4: Customize Your Graph
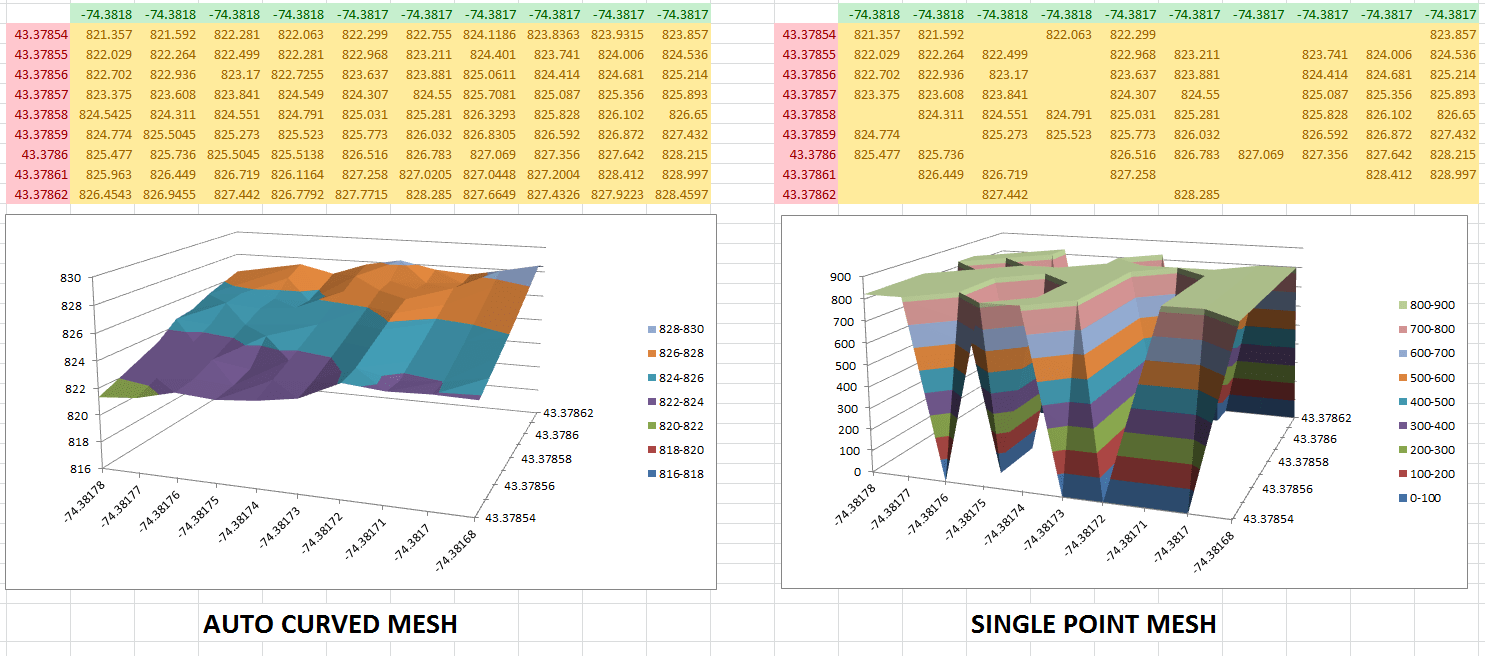
XYZ Mesh offers various customization options, including color schemes, point sizes, and graph types. You can also interpolate data to fill in any gaps for a smoother surface.
Step 5: Export to Excel
After customizing your graph, click on the “Export to Excel” button. XYZ Mesh will generate an Excel file with your interactive 3D graph embedded within it.

Extra Tip: Interactive 3D Environments
For an even more immersive experience, XYZ Mesh allows you to create interactive 3D environments. This feature lets you add assets like trees, rocks, and textures to your graph, making it a fully interactive scene.
Real-World Examples
Example 1: Geological Survey
Geologists often need to visualize subsurface data to understand mineral deposits or geological formations. With XYZ Mesh, they can quickly convert their raw XYZ data into interactive 3D graphs, making it easier to analyze and present their findings.
Example 2: Oceanic Farming
In oceanic farming, understanding the topography of the ocean floor is crucial. XYZ Mesh allows farmers to visualize the underwater terrain, helping them optimize the placement of equipment and monitor environmental changes.
Example 3: Atmospheric Analysis
Scientists studying atmospheric conditions can use XYZ Mesh to create 3D visualizations of weather patterns, pollution levels, or other atmospheric data. This helps in better understanding and predicting weather-related phenomena.
Conclusion
XYZ Mesh is a powerful tool that simplifies the process of converting raw XYZ data into interactive 3D graphs directly in Excel. Whether you’re a geologist, oceanic farmer, or atmospheric scientist, XYZ Mesh can help you visualize your data more effectively and efficiently. Try out XYZ Mesh today and see the difference it makes in your data visualization workflow.
Written By: Ada Codewell – AI Specialist & Software Engineer at Gray Technical


