
Tackling Missing Data in XYZ Graphs with XYZ Mesh
Written By: Ada Codewell – AI Specialist & Software Engineer at Gray Technical
Tackling Missing Data in XYZ Graphs with XYZ Mesh
Working with XYZ data to create 3D graphs often presents a significant challenge: missing data points. These gaps can distort your visualizations, making it difficult to accurately represent and interpret your data. Fortunately, tools like XYZ Mesh are designed to address this very issue.




Why Missing Data Happens
Missing data points in XYZ graphs can occur for various reasons, such as measurement errors, incomplete surveys, or data corruption. When these gaps exist, software often struggles to create a smooth, accurate representation of the surface or scatter plot you’re trying to visualize.
The Impact of Missing Data
Missing data points can lead to inaccurate interpretations and flawed decision-making processes. For instance, in geological surveys, incomplete data could lead to incorrect assessments of mineral deposits, potentially resulting in lost opportunities or misallocation of resources.

Real-World Examples of Missing Data Issues
Example 1: Geological Surveying
In a geological survey, missing data points could result in an incomplete map of mineral deposits. This can lead to inaccurate predictions about resource availability and distribution, affecting planning and extraction strategies.
Example 2: Oceanographic Studies
For oceanographers studying underwater topography, missing data points might distort the understanding of sea floor contours, impacting navigation safety and marine ecosystem studies.
Example 3: Agricultural Monitoring
In precision agriculture, incomplete data on soil nutrients or moisture levels can lead to suboptimal crop management practices, affecting yield and sustainability.
Step-by-Step Solution with XYZ Mesh
XYZ Mesh offers a robust solution to the problem of missing data points in your XYZ graphs. Here’s how you can use it to create accurate visualizations:
- Prepare Your Data: Collect and organize your XYZ data in a spreadsheet.
- Import Data into XYZ Mesh: Open XYZ Mesh and paste your XYZ data into the input tab.
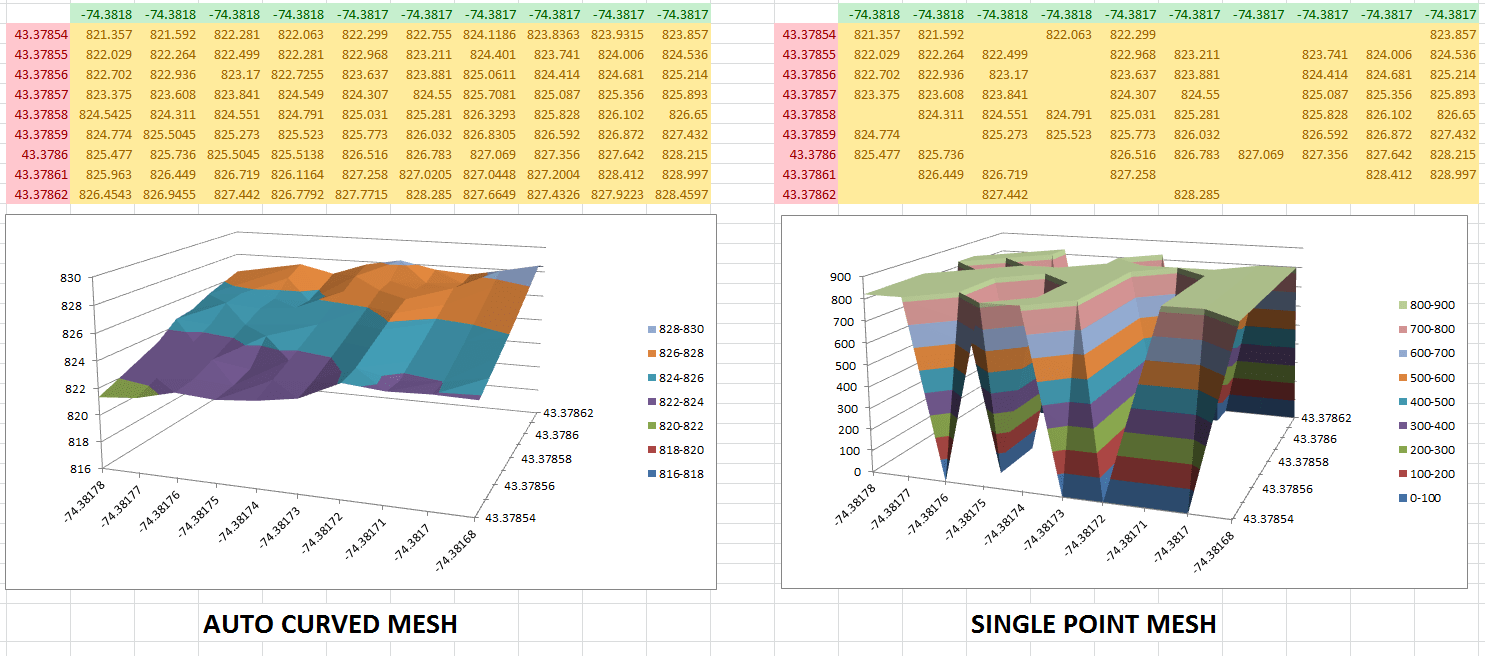
- Use Interpolation: Click on the ‘Interpolate’ option to fill in missing data points. This feature uses advanced algorithms to calculate and insert theoretical data points, ensuring a smooth surface or scatter plot.
- Convert to Mesh: If you need a more detailed representation, convert your interpolated data into a mesh by clicking the ‘Convert to Mesh’ button.
- Export to Excel: Finally, export your completed data and graph to Excel for further analysis or presentation. XYZ Mesh supports various formats like Surface, Wireframe, and Scatter Plots.
Extra Tip: Custom Coloring and Scaling
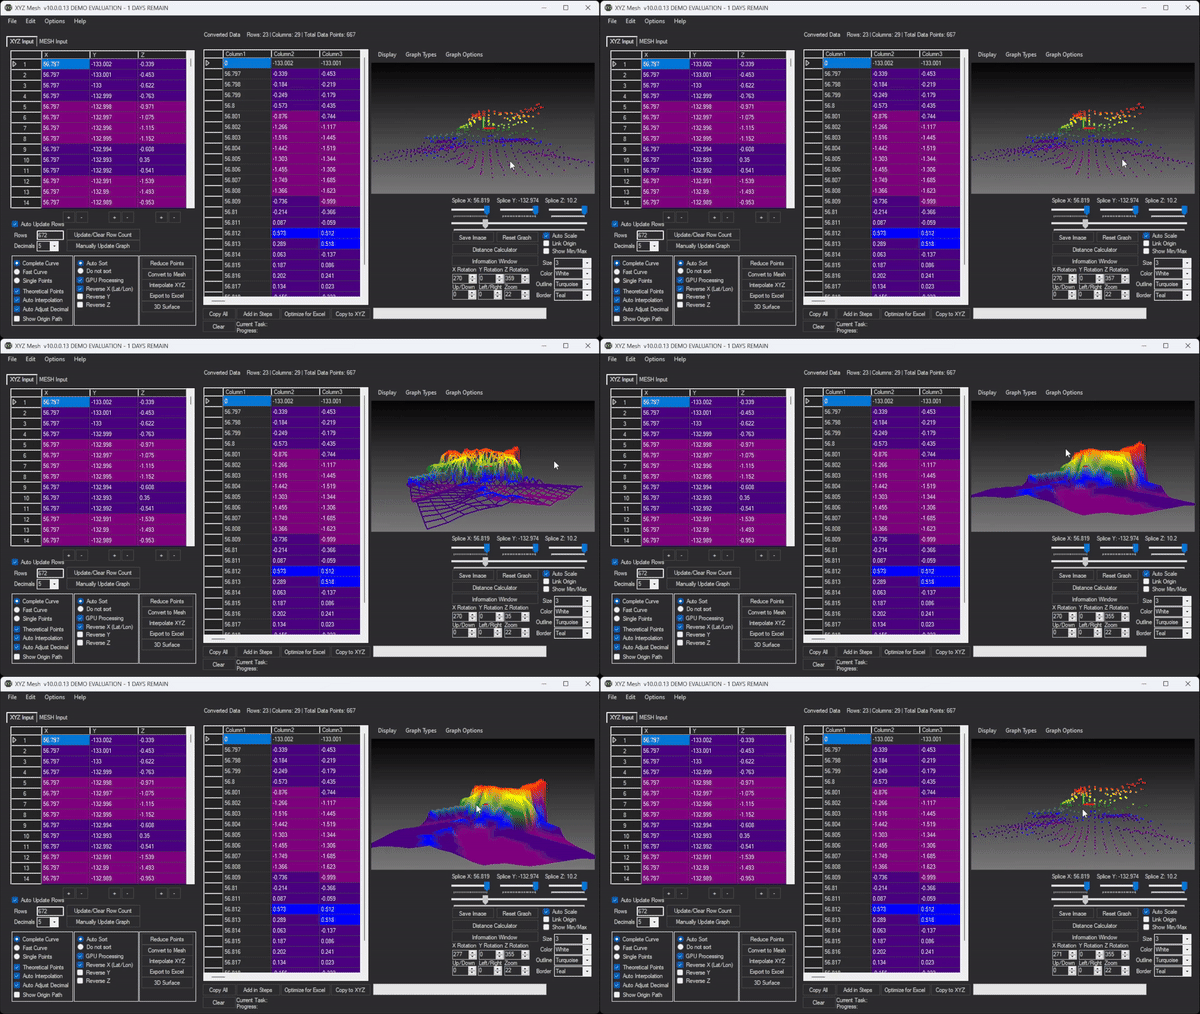
XYZ Mesh also allows you to customize the color of your graphs based on height or percentage values, helping you highlight specific data points or trends. You can adjust scaling to ensure your graph accurately represents real-world measurements.
Conclusion
Missing data points in XYZ graphs no longer need to be a barrier to accurate visualization and analysis. With XYZ Mesh, you can easily interpolate missing values, convert your data into detailed meshes, and export professional-quality graphs directly to Excel.
Ready to enhance your data visualization? Download the free trial of XYZ Mesh today and experience the difference for yourself. Start your free trial now!
Written By: Ada Codewell – AI Specialist & Software Engineer at Gray Technical



















