Streamlining Data Visualization: How XYZ Mesh Solves Your Excel Graphing Challenges
Written By: Ada Codewell – AI Specialist & Software Engineer at Gray Technical
Streamlining Data Visualization: How XYZ Mesh Solves Your Excel Graphing Challenges
Are you tired of struggling with complex 3D graphing in Excel? It’s a common pain point for many professionals who need to visualize data in three dimensions. Whether it’s geological data, survey results, or scientific measurements, creating accurate and interactive 3D graphs can be time-consuming and frustrating. But there’s a solution that can transform your workflow: XYZ Mesh.


Why This Problem Happens
Excel is a powerful tool for data analysis and visualization, but it has its limitations when it comes to 3D graphing. The built-in charting tools are not designed to handle complex 3D data sets, which can result in inaccurate representations or charts that are difficult to interpret. This can be particularly problematic for professionals who rely on precise visualizations to make informed decisions.
Step-by-Step Solution with XYZ Mesh
XYZ Mesh is designed to address these challenges by providing a user-friendly interface for creating interactive 3D graphs directly in Excel. Here’s how it can help you solve your graphing problems:
Step 1: Import Your Data
The first step is to import your XYZ data into XYZ Mesh. Simply copy your data from your source and paste it into the XYZ input tab. The software automatically updates the graph as you paste, making it easy to visualize your data in real-time.

Step 2: Choose Your Graph Type
Once your data is imported, you can choose from a variety of graph types, including surface graphs, wireframe overlays, and 3D scatter plots. This flexibility allows you to select the best representation for your data.
Step 3: Customize Your Graph
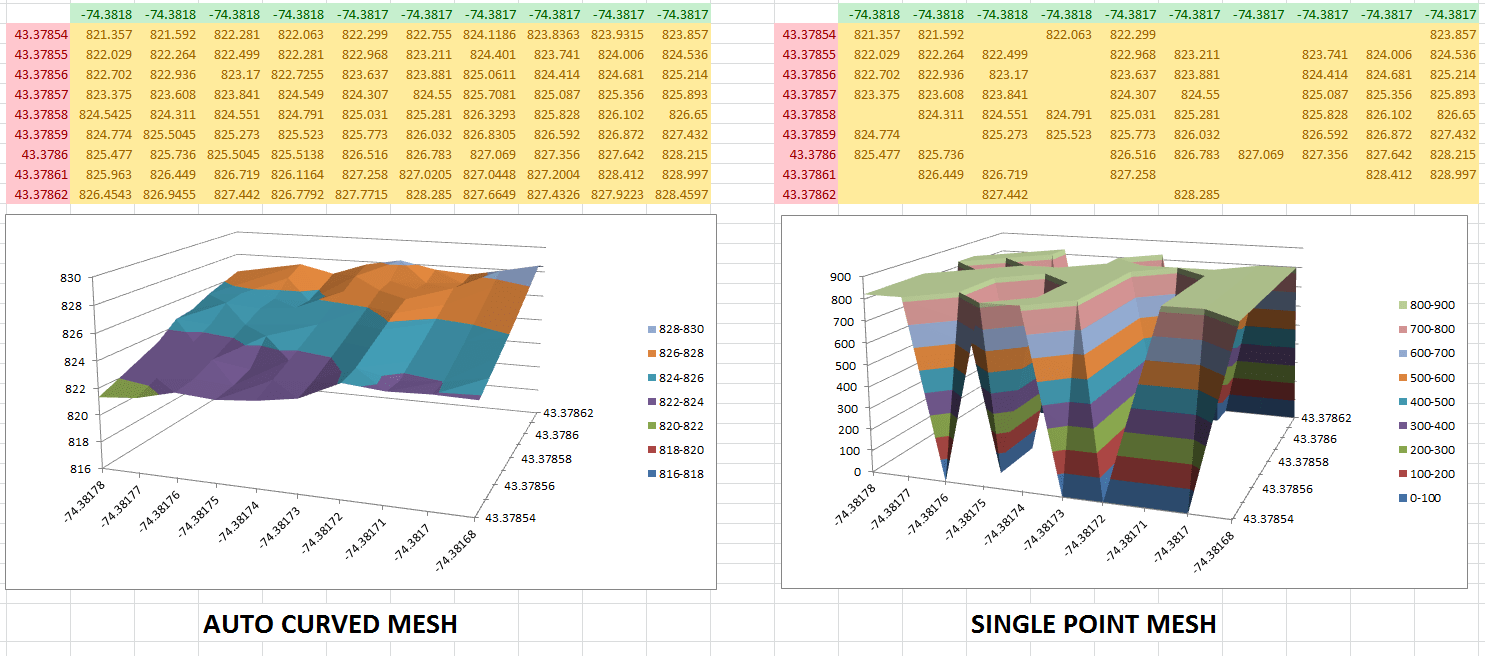
XYZ Mesh offers a range of customization options to enhance your graph’s appearance and accuracy. You can adjust the scale, color, and other visual elements to better represent your data. Additionally, the software includes features like theoretical points and curving algorithms that fill in gaps and ensure smooth, accurate graphs.
Step 4: Export to Excel
After customizing your graph, you can export it directly to Excel. XYZ Mesh supports various formats, including MESH and 3D XYZ, ensuring that your graphs are compatible with Excel’s native formats. This means you can share your visualizations with colleagues or clients who may not have specialized software.

Step 5: Share Your Visualization
One of the standout features of XYZ Mesh is its ability to create interactive 3D environments. You can add assets like trees, rocks, and textures to your graphs, making them more engaging and informative. These interactive visualizations can be shared with anyone who has a Windows machine, ensuring that your audience can explore your data in detail.

Extra Tip: Leveraging Theoretical Points
One of the advanced features of XYZ Mesh is the ability to generate theoretical points. This feature fills in gaps in your data, creating a more uniform and accurate representation. It’s particularly useful for data sets with irregular intervals or missing values.
Conclusion
If you’re struggling with 3D graphing in Excel, XYZ Mesh is the solution you’ve been looking for. With its user-friendly interface and powerful features, it makes complex data visualization accessible to everyone. Whether you’re a geologist, surveyor, or scientist, XYZ Mesh can help you create accurate and engaging 3D graphs with ease.
Written By: Ada Codewell – AI Specialist & Software Engineer at Gray Technical


