Solving XYZ Data Visualization Challenges with XYZ Mesh
Written By: Ada Codewell – AI Specialist & Software Engineer at Gray Technical
Solving XYZ Data Visualization Challenges with XYZ Mesh
Have you ever struggled to turn your raw XYZ data into meaningful visuals? If you’re dealing with complex datasets, creating accurate and interactive 3D graphs can be a nightmare. Whether it’s for geological modeling, land surveying, or scientific research, visualizing XYZ data accurately is crucial.


Why Visualizing XYZ Data is Challenging
Visualizing XYZ data isn’t as straightforward as it seems. Excel can handle basic graphs, but when it comes to complex 3D visualizations, it falls short. The main challenges include:
- Data Gaps: Missing data points make it difficult to create accurate representations.
- Complexity: Generating smooth curves and surfaces from raw XYZ data requires complex algorithms.
- Sharing Results: Exporting 3D visuals into a shareable format can be cumbersome and error-prone.
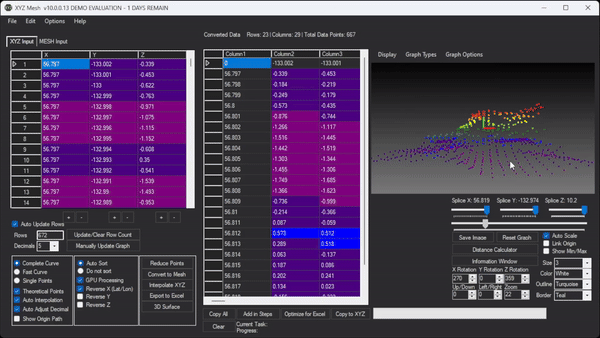
XYZ Mesh: The Solution to Your XYZ Data Visualization Woes
XYZ Mesh is a powerful tool designed to turn your raw XYZ data into interactive 3D graphs with ease. Here’s how it can solve your visualization challenges:
Three Real-World Examples of XYZ Mesh in Action

Example 1: Geological Modeling
Geologists often need to visualize subsurface formations to understand mineral deposits or shale layers. With XYZ Mesh, you can import your XYZ data and generate a detailed 3D model that highlights these formations. The tool’s ability to interpolate missing data ensures that your model is as accurate as possible.
Example 2: Land Surveying
In land surveying, visualizing terrain data is essential for planning and development. XYZ Mesh allows you to create detailed 3D surface models that can be used to identify elevation changes, slopes, and other critical features. The interactive nature of these models means you can rotate, zoom, and pan to get a comprehensive view of the landscape.
Example 3: Oceanic Farming
For oceanic farming, understanding the underwater topography is crucial for optimizing the placement of farms. XYZ Mesh can help by creating detailed underwater terrain models that highlight the best spots for farming. The tool’s ability to export these models into interactive formats makes it easy to share findings with stakeholders.
Step-by-Step Guide to Using XYZ Mesh
Step 1: Import Your XYZ Data
Start by importing your raw XYZ data into XYZ Mesh. The tool supports various formats, making it easy to get started.
Step 2: Interpolate Missing Data
Use XYZ Mesh’s interpolation features to fill in any gaps in your data. This ensures that your 3D model is as accurate and smooth as possible.
Step 3: Generate Your 3D Model
Choose the type of graph you want to create—whether it’s a surface model, scatter plot, or line graph. XYZ Mesh will generate a detailed 3D model based on your data.
Step 4: Customize Your Visuals
Customize the colors, textures, and other visual elements of your 3D model to make it more informative and visually appealing.
Step 5: Export and Share
Export your 3D model into a shareable format. XYZ Mesh supports various export options, including Excel and interactive 3D formats, making it easy to share your visuals with others.
Extra Tip: Using Custom Textures for Better Visualization
One of the advanced features of XYZ Mesh is the ability to add custom textures to your 3D models. This can help you create more realistic and informative visuals that better represent your data.

Conclusion
Visualizing XYZ data doesn’t have to be a headache. With XYZ Mesh, you can turn your raw data into detailed, interactive 3D models with ease. Whether you’re a geologist, land surveyor, or oceanic farmer, this tool has the features you need to create accurate and informative visuals.
Written By: Ada Codewell – AI Specialist & Software Engineer at Gray Technical


