Solving XYZ Data Visualization Challenges with XYZ Mesh
Written By: Ada Codewell – AI Specialist & Software Engineer at Gray Technical
Solving XYZ Data Visualization Challenges with XYZ Mesh
Written By: Ada Codewell – AI Specialist & Software Engineer at Gray Technical.
Visualizing XYZ data can be a significant challenge in Excel. With its limited 3D graphing capabilities, creating meaningful visual representations from XYZ datasets often leads to frustration and inaccurate results. This is where XYZ Mesh comes into play, offering a streamlined solution for converting raw XYZ data into interactive 3D graphs directly within Excel.
Why Visualizing XYZ Data in Excel is Difficult
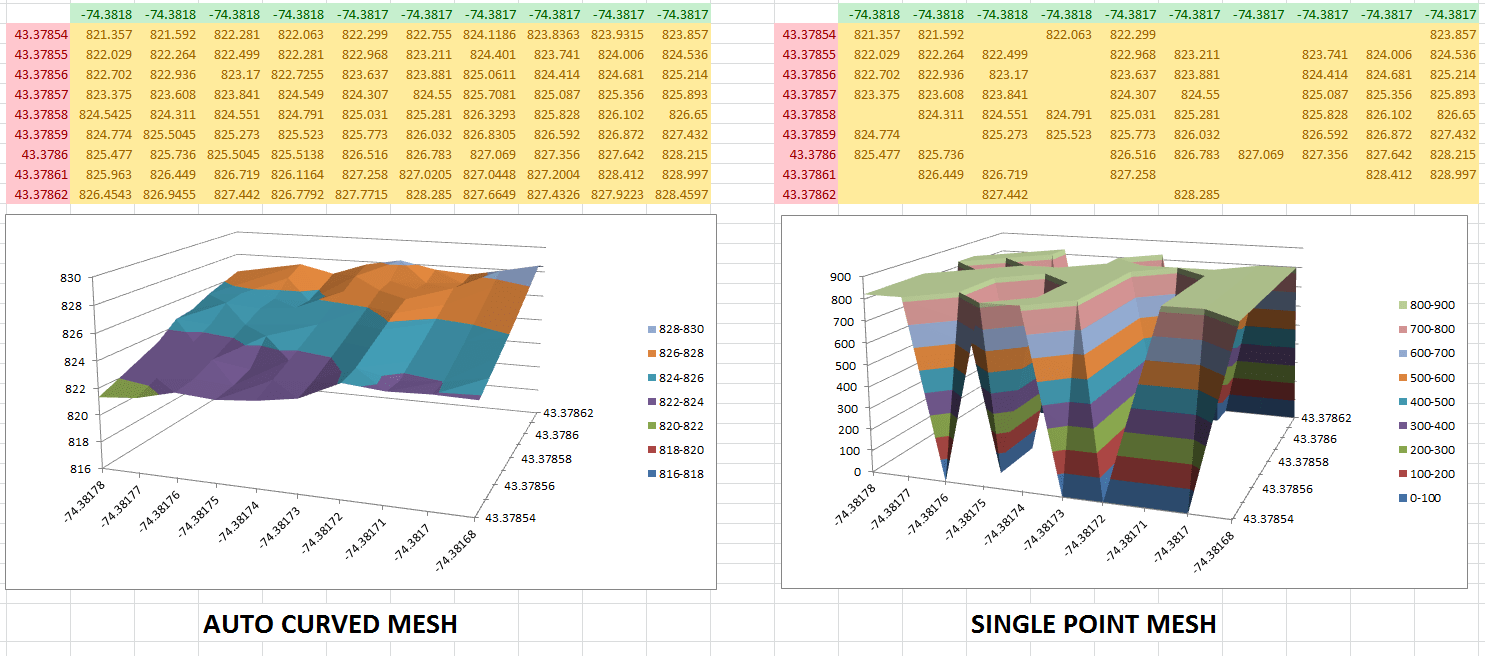
Excel is widely used for its powerful spreadsheet capabilities, but it falls short when it comes to complex 3D visualizations. The built-in graphing tools are limited and can’t handle the intricacies of XYZ data effectively. This often results in:
- Inaccurate representations
- Time-consuming manual adjustments
- Limited interactivity with graphs
These limitations are particularly problematic for professionals who rely on precise data visualizations, such as geologists, engineers, and researchers.
The Solution: XYZ Mesh
XYZ Mesh is designed to address these challenges by providing a seamless way to convert XYZ data into interactive 3D graphs directly in Excel. It offers a range of features that enhance data visualization, including:
- Automatic curve algorithms
- Data interpolation for filling gaps
- Export capabilities to various formats (Excel, DXF, KML)
- Interactive 3D environment creation
XYZ Mesh leverages GPU and multi-threaded CPU calculations to handle large datasets efficiently, ensuring smooth performance even with complex data.
Step-by-Step Solution
Example 1: Creating a 3D Surface Graph in Excel

To create a 3D surface graph using XYZ Mesh, follow these steps:
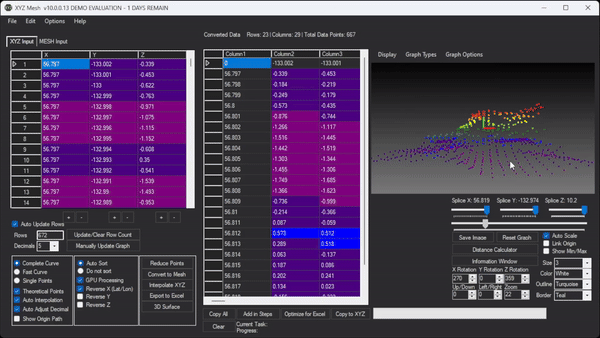
- Prepare Your Data: Copy your XYZ data from your source and open XYZ Mesh.
- Paste Data into XYZ Mesh: Paste the copied data into the XYZ input tab of XYZ Mesh.
- Convert to Mesh: Click on “Convert to Mesh” to transform your XYZ data into a 3D mesh format that Excel can interpret.
- Interpolate Data: Use the interpolation feature to fill in any gaps in your data, ensuring a smooth surface.
- Export to Excel: Click on “Export to Excel” and choose the desired graph type (e.g., Surface or Wireframe).
- Interact with Your Graph: Open the exported Excel file and interact with your 3D graph using Excel’s built-in tools.
Example 2: Generating a 3D Scatter Plot
To create a 3D scatter plot, follow these steps:
- Prepare Your Data: Copy your XYZ data from your source and open XYZ Mesh.
- Paste Data into XYZ Mesh: Paste the copied data into the XYZ input tab of XYZ Mesh.
- Interpolate Data: Use the interpolation feature to fill in any gaps in your data.
- Export to Excel: Click on “Export to Excel” and choose the 3D Scatter Plot option.
- Interact with Your Graph: Open the exported Excel file and interact with your 3D scatter plot using Excel’s built-in tools.
Example 3: Creating an Interactive 3D Environment
To create an interactive 3D environment, follow these steps:
- Prepare Your Data: Copy your XYZ data from your source and open XYZ Mesh.
- Paste Data into XYZ Mesh: Paste the copied data into the XYZ input tab of XYZ Mesh.
- Convert to Mesh: Click on “Convert to Mesh” to transform your XYZ data into a 3D mesh format.
- Open 3D Surface Render: Navigate to the 3D Surface Render option and configure your environment settings (e.g., textures, assets, paths).
- Export 3D Viewer: Click on “Export 3D Viewer” to save your interactive 3D environment.
- Share Your Environment: Share the exported folder with anyone who has a Windows machine, allowing them to explore your data interactively.
Conclusion
XYZ Mesh solves the common challenges of visualizing XYZ data in Excel by providing a powerful and intuitive platform for creating interactive 3D graphs. Whether you’re working with surface models, scatter plots, or complex environments, XYZ Mesh offers the tools you need to transform your data into meaningful visualizations.
Ready to elevate your data visualization game? Try XYZ Mesh today and experience the difference for yourself!


