Solving the Frustrating Problem of 3D Data Visualization in Excel
Written By: Ada Codewell – AI Specialist & Software Engineer at Gray Technical
Solving the Frustrating Problem of 3D Data Visualization in Excel
If you’ve ever struggled with creating accurate and interactive 3D graphs directly within Excel, you’re not alone. While Excel is a powerful tool for data analysis, its native capabilities for 3D visualization are limited and often frustrating to use. However, there’s a solution that can transform your 3D graphing experience in Excel: XYZ Mesh.


Why Does This Problem Happen?
Excel’s built-in charting tools are great for 2D data, but when it comes to 3D visualization, they fall short. The native 3D graphs in Excel are often static and lack the interactivity needed for in-depth analysis. This limitation can be a significant obstacle for professionals who need to present complex data in an engaging and understandable way.
Real-World Examples
Example 1: Geological Survey Data
Geologists often need to analyze and visualize subsurface geological formations. Traditional methods using Excel’s native tools can be cumbersome, leading to inaccurate representations of the terrain. By using XYZ Mesh, geologists can create detailed 3D surface models that provide a clearer picture of the geological structures.

Example 2: Oceanographic Research
Oceanographers need to visualize underwater topographies, which are inherently three-dimensional. With XYZ Mesh, they can convert XYZ data into interactive 3D scatter plots and surface models that help them better understand ocean floor structures.
Example 3: Architectural Design
Architects often need to visualize building designs in 3D. Using Excel’s native tools for this purpose can be extremely limiting. With XYZ Mesh, architects can create detailed and interactive 3D models of their designs, which can then be easily shared with clients and stakeholders.
Step-by-Step Solution
Using XYZ Mesh to create interactive 3D graphs in Excel is straightforward. Follow these steps:
- Download and install XYZ Mesh from the official website.
- Open XYZ Mesh and paste your XYZ data into the input tab.
- Choose the type of graph you want to create (3D Scatter Plot, 3D Surface Model, etc.).
- Customize your graph with options like color, scale, and theoretical points.
- Export your graph directly into Excel by clicking the “Export to Excel” button.
- Open the exported Excel file to view and interact with your 3D graph.
Extra Tip: Using Theoretical Points
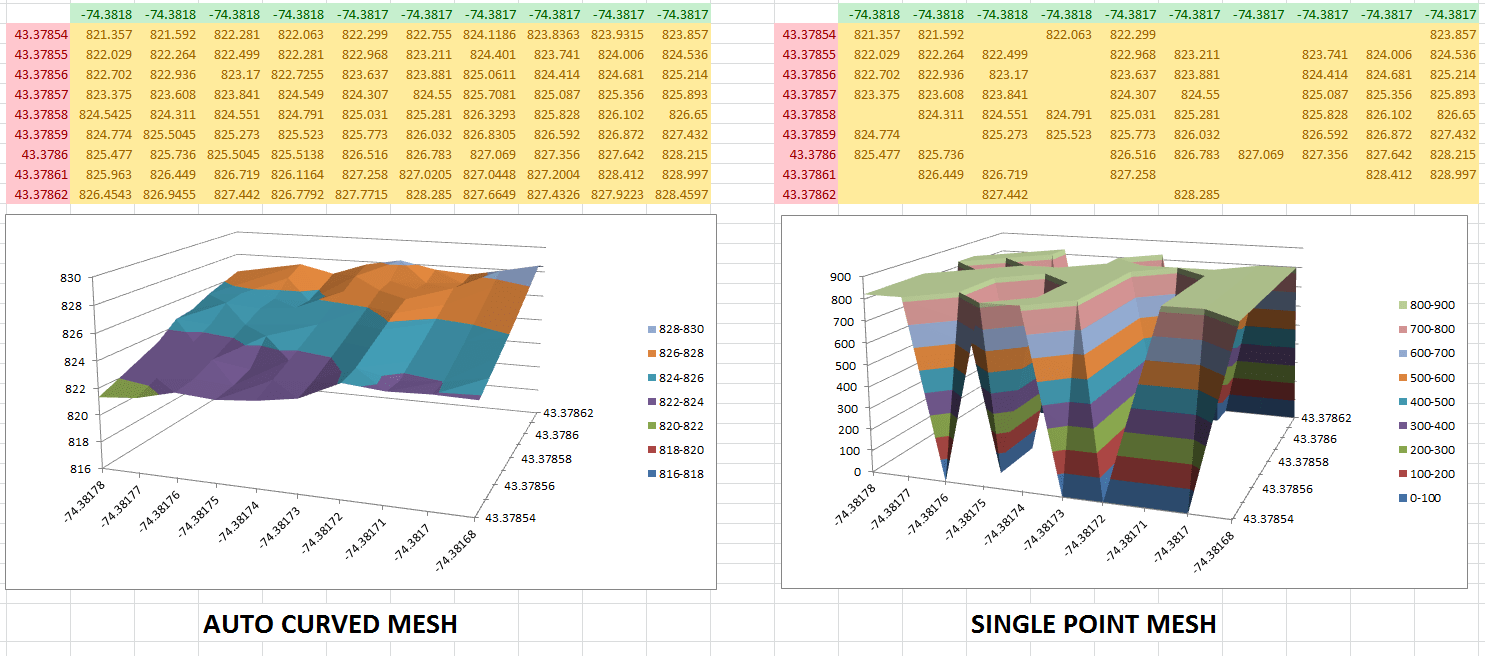
One of the standout features of XYZ Mesh is its ability to fill in missing data points using theoretical calculations. This ensures that your 3D graphs are smooth and accurate, even if your original data has gaps.

Conclusion
If you’re struggling with 3D data visualization in Excel, XYZ Mesh is the solution you’ve been looking for. It transforms your raw XYZ data into interactive and accurate 3D graphs, making it easier to analyze and present complex data. Try it out today and see the difference it can make in your workflow.
Written By: Ada Codewell – AI Specialist & Software Engineer


