Solving Data Visualization Challenges with XYZ Mesh: A Comprehensive Guide
Written By: Ada Codewell – AI Specialist & Software Engineer at Gray Technical
Solving Data Visualization Challenges with XYZ Mesh: A Comprehensive Guide
When working with complex datasets that involve three-dimensional data points, creating accurate and visually informative graphs can be a daunting task. Excel, while powerful, often falls short when it comes to handling 3D data effectively. This is where XYZ Mesh steps in as an invaluable tool for converting raw XYZ data into interactive 3D graphs directly within Excel.


The Challenge with 3D Data Visualization
Data visualization is crucial for understanding trends, patterns, and relationships in datasets. However, when dealing with three-dimensional data, the complexity increases significantly. Standard tools like Excel can create basic charts, but they often struggle to deliver detailed and interactive 3D visualizations.

Why This Problem Happens
There are several reasons why 3D data visualization is challenging:
- Complexity of Data: Three-dimensional data involves multiple variables and relationships that need to be accurately represented.
- Software Limitations: Standard software tools like Excel have limitations when it comes to creating detailed and interactive 3D graphs.
- Time and Effort: Creating accurate 3D visualizations manually can be time-consuming and requires specialized skills.
Step-by-Step Solution with XYZ Mesh
XYZ Mesh offers a streamlined solution to these challenges. Here’s how you can effectively use it:
Step 1: Install XYZ Mesh
First, download and install XYZ Mesh from the official website. Follow the installation instructions to ensure proper setup.
Step 2: Import Your Data
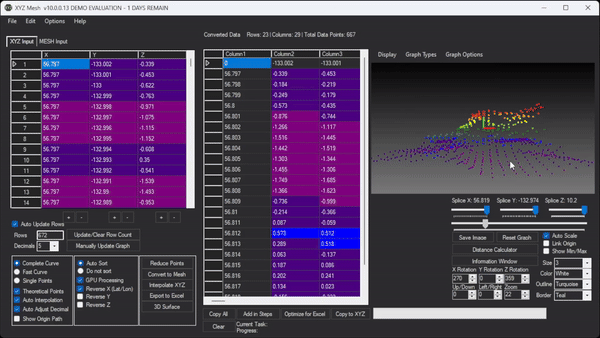
Open XYZ Mesh and import your XYZ data by copying it from Excel or any other source and pasting it into the input tab of XYZ Mesh.
Step 3: Convert to Mesh
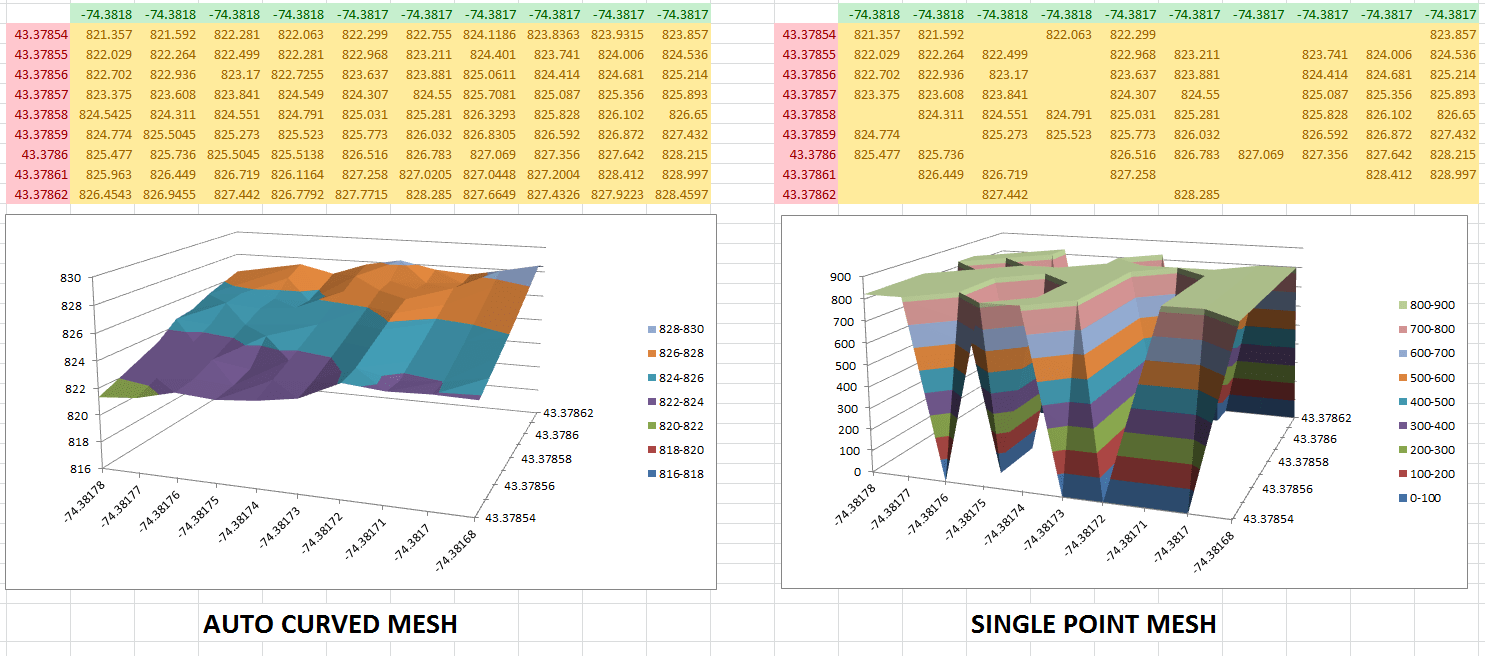
Use the “Convert to Mesh” feature to convert your XYZ data into a format that can be used for 3D visualization. This process fills in any gaps and ensures smooth transitions between data points.
Step 4: Customize Your Graph
Customize your graph by selecting different visualization options such as surface, wireframe, or scatter plot. You can also adjust colors, textures, and other visual elements to suit your needs.
Step 5: Export to Excel
Once you are satisfied with the visualization, export it back to Excel using the “Export to Excel” feature. This will generate an interactive 3D graph that can be shared and presented easily.
Extra Tip: Interactivity and Sharing
One of the standout features of XYZ Mesh is its ability to create interactive 3D environments. You can add assets like trees, rocks, and textures to make your visualizations more engaging. These interactive elements can be easily shared with clients or team members who have access to Excel.
Real-World Examples
Let’s look at a few real-world examples where XYZ Mesh has proven to be invaluable:
Example 1: Geological Surveying
Geologists often need to visualize subsurface formations to understand the distribution of minerals or geological structures. With XYZ Mesh, they can import survey data, convert it to a 3D mesh, and create detailed visualizations that help in making informed decisions.
Example 2: Environmental Monitoring
Environmental scientists use XYZ Mesh to visualize pollution levels across different regions. By converting air quality data into interactive 3D graphs, they can effectively communicate the impact of pollutants and propose mitigation strategies.
Example 3: Architectural Design
Architects use XYZ Mesh to create 3D models of proposed buildings or urban layouts. This helps in visualizing the design from different angles and making necessary adjustments before construction begins.

Conclusion
XYZ Mesh is a powerful tool that addresses the challenges of 3D data visualization. By converting raw XYZ data into interactive 3D graphs within Excel, it simplifies complex data representation and enhances communication. Whether you are a geologist, environmental scientist, or architect, XYZ Mesh offers a streamlined solution to your visualization needs.
Written By: Ada Codewell – AI Specialist & Software Engineer
Try XYZ Mesh today and see the difference it makes in your data visualization projects!


