
How to Create Interactive 3D Surface Plots in Excel with XYZ Data
Written By: Ada Codewell – AI Specialist & Software Engineer at Gray Technical
How to Create Interactive 3D Surface Plots in Excel with XYZ Data
If you’re a professional dealing with geospatial data, topographic surveys, or any kind of scientific research, you know that visualizing your XYZ data can be challenging, especially when you want to create interactive 3D plots directly in Excel. This article will guide you through solving this common pain point using the powerful XYZ Mesh software.




The Problem: Creating Interactive 3D Plots in Excel
Excel is a fantastic tool for data analysis and visualization, but it has its limitations when it comes to creating interactive 3D surface plots from XYZ data. Standard Excel charts often fall short of providing the depth and interactivity needed for detailed scientific or engineering analysis.
Why This Happens
Excel’s built-in 3D charting capabilities are limited and can be difficult to work with when dealing with large datasets or complex surface models. The process is often manual, time-consuming, and doesn’t produce the high-quality visualizations that professionals need.
Step-by-Step Solution: Using XYZ Mesh for Interactive 3D Plots
XYZ Mesh is designed to address these limitations by converting XYZ data into professional-quality 3D visualizations that can be used directly in Excel. Here’s a step-by-step guide on how to use it:
Step 1: Gather Your XYZ Data
First, you need your XYZ data, which can come from various sources like GPS devices, surveying equipment, or simulation software. Make sure your data is in a tabular format with X, Y, and Z columns.
Step 2: Install XYZ Mesh
Download and install XYZ Mesh from the official website. The software is compatible with Windows 7-11 and Excel 2010-2024, including Office 365 (offline).
Step 3: Import Data into XYZ Mesh
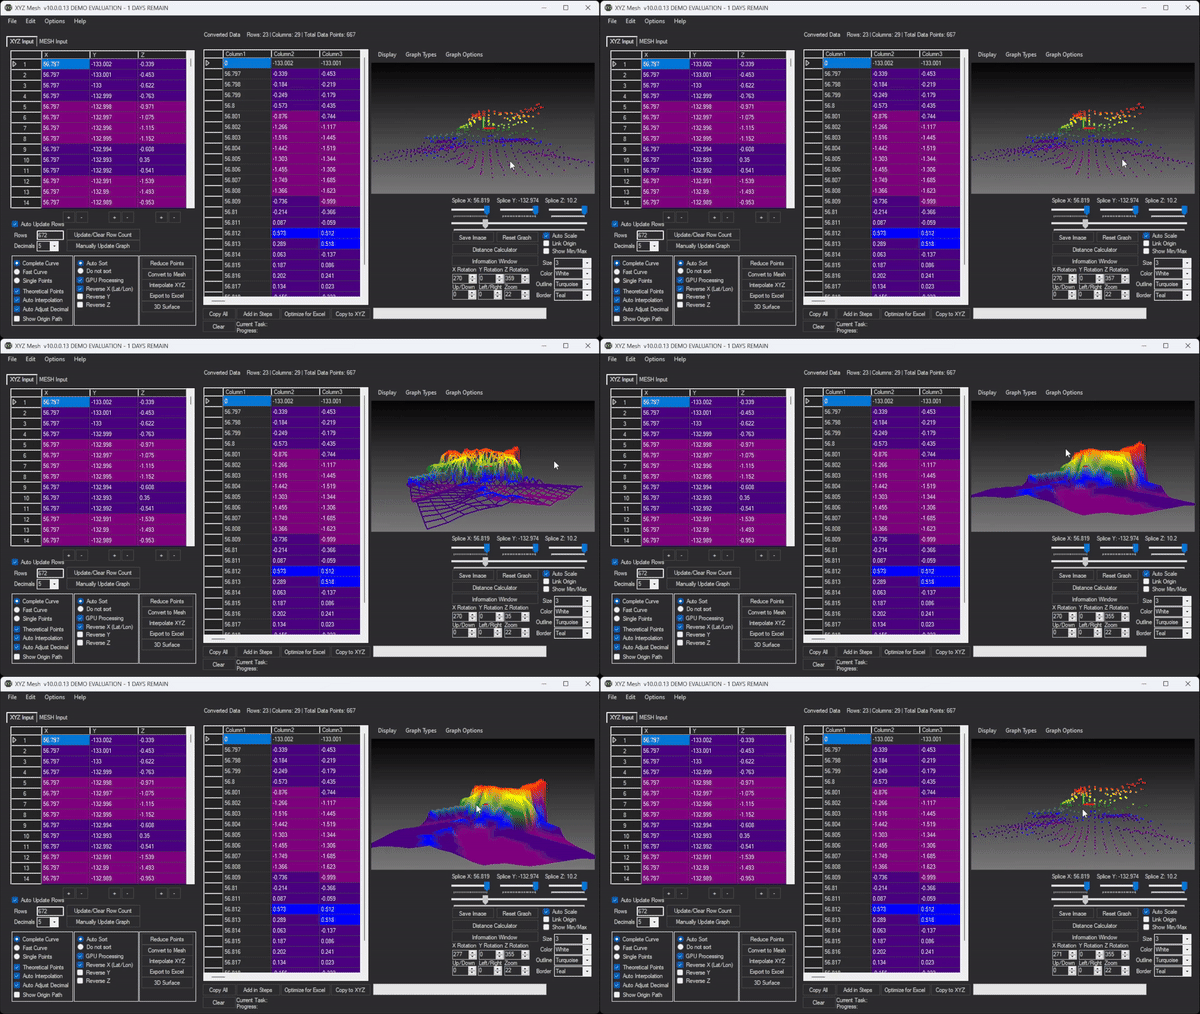
Open XYZ Mesh and paste your XYZ data into the input tab. The software will automatically detect the format and plot it in 3D.
Step 4: Customize Your Visualization
XYZ Mesh offers several customization options:
- Choose between surface, wireframe, or heat map visualizations.
- Adjust the graph colors based on percentages, custom heights, or your preferred color scheme.
- Use theoretical points to fill in gaps and create a smoother surface representation.
Step 5: Export to Excel
Once you’re satisfied with your visualization, export it to Excel. XYZ Mesh directly exports the data into native Excel formats, ensuring compatibility and ease of use.
Real-World Examples
Let’s look at three real-world scenarios where XYZ Mesh can be applied:
Example 1: Topographic Mapping
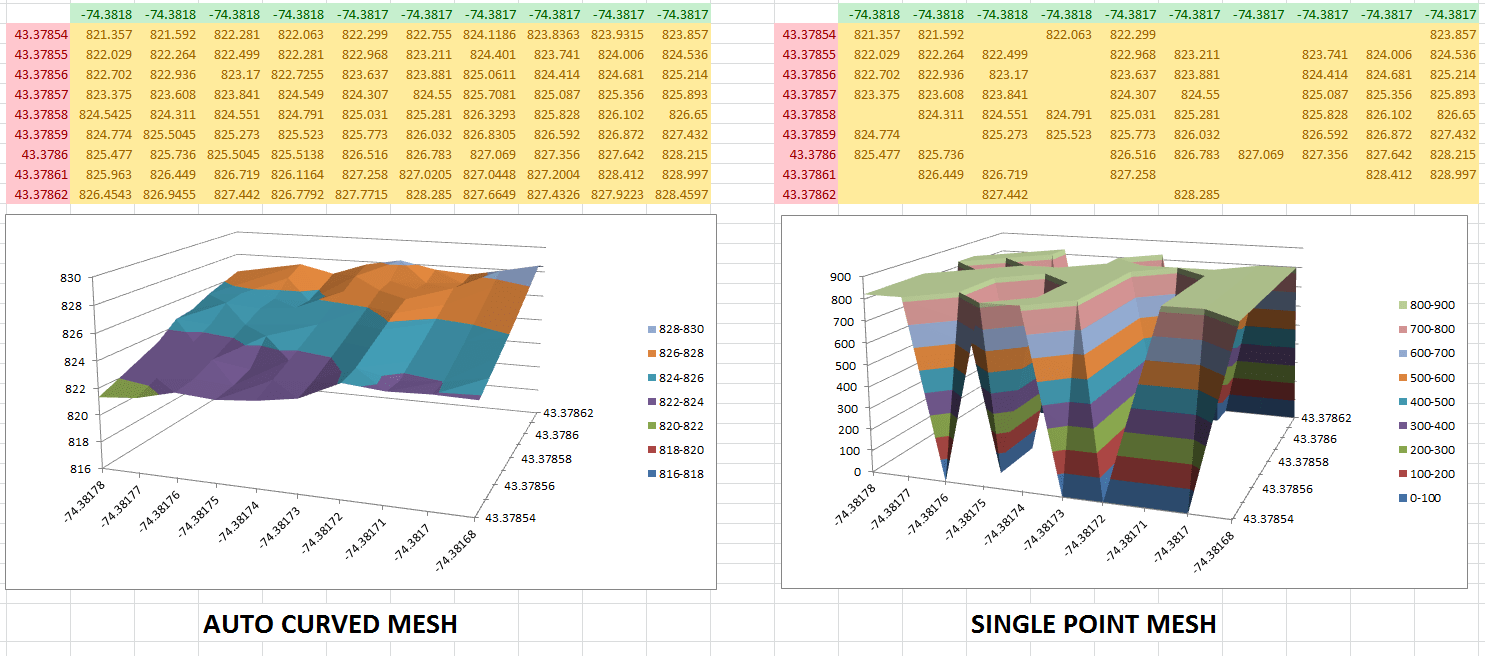
Surveyors often need to create topographic maps from surveyed data points. With XYZ Mesh, you can quickly convert these points into a 3D surface plot that clearly shows the terrain’s structure and topology.

Example 2: Engineering Design
Engineers working on infrastructure projects can use XYZ Mesh to visualize the surface profiles of land areas. This helps in planning and design by providing a clear understanding of the terrain’s characteristics.
Example 3: Environmental Research
Researchers studying land erosion or geological formations can use XYZ Mesh to create detailed 3D models of the earth’s surface. These models can be used for analysis and presentation purposes.
Advanced Tip: Custom Branding and Interactive Environments
For business users, XYZ Mesh offers additional features like custom company branding on Excel exports and the ability to create interactive 3D environments with textures and assets. This is ideal for presentations where you want to provide a fully immersive experience of your surface data.
Conclusion
Creating interactive 3D surface plots in Excel from XYZ data no longer has to be a challenge. With XYZ Mesh, you can quickly and easily convert your data into professional-quality visualizations that are ready for use in Excel. Whether you’re a surveyor, engineer, or researcher, XYZ Mesh provides the tools you need to visualize your data effectively.
Ready to take your data visualization to the next level? Try XYZ Mesh today and experience the difference for yourself.
Written By: Ada Codewell – AI Specialist & Software Engineer at Gray Technical
Product Images





















