How to Graph XYZ Data into MESH Inside Microsoft Excel
 Summary: Learn how to graph XYZ data in 3D inside of Microsoft Excel
Article by: Kyle Gray
Gray Technical, LLC – CEO
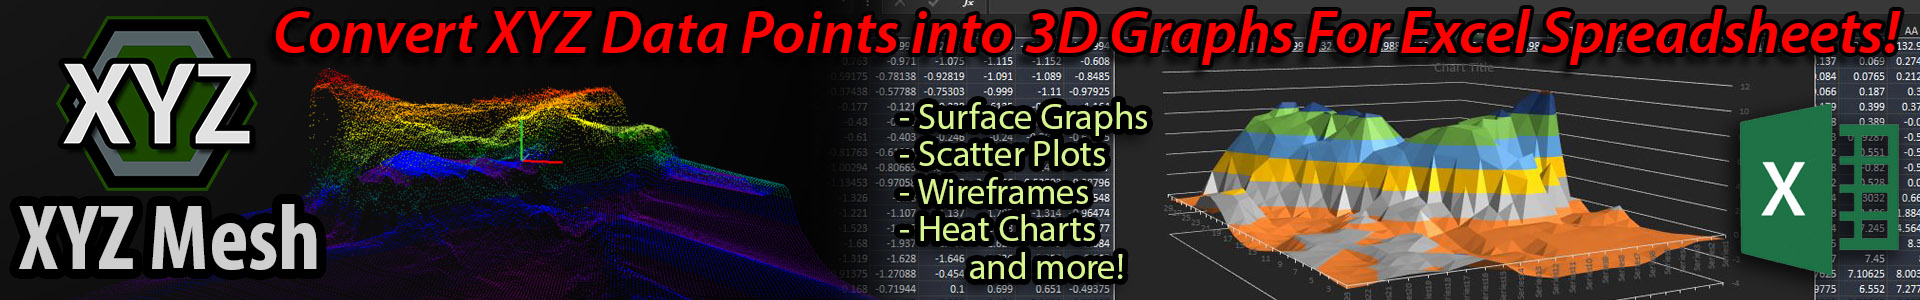
This new post covers more methods on plotting XYZ values in 3D inside Excel and explains how to with and without third-party applications.
How to Graph XYZ Data into MESH Inside Microsoft Excel

If you have tried to take X Y Z data and graph it three dimensionally inside of Microsoft Excel then you know that Excel’s graphing capabilities are quite limited. So how then do people graph XYZ data in 3D with surface or wireline graphs? Actually there are a couple methods, one that is time consuming and tedious while the other is quick and painless. In this post I will be sharing both methods and show you how to visually improve your XYZ data with 3D Surface and Wireframe graphs.
Viewing XYZ Data in 3D with Excel
3D Line Graphs/Scatter Charts
XYZ data can be graphed in many different ways using 2D methods. Line graphs, bar graphs and even scatter charts. All these methods alone will only allow you to graph two sets of data, or in other words, 2D. However by combining the 2D mediums you can generate a 3D object.
What you need to first realize is that a 3D object consists of 3 planes. X, Y and Z. X being your width, Y as your height and Z as your depth. Most people already know this, but few realize this concept of showing a 3D object also stands true for 2D objects. The only difference is that one of the Axis is not being shown. In other words, it is like you are viewing the object from the top (XY), front (ZX) or the right (YZ).

 Using this data inside an algorithm makes it possible to generate a 3D image. There is an active blog that uses such algorithms in formulas to generate many interested graphs inside Excel. The blog also has tutorials and example sheets that can be found here: Excel Unusual. However these formulas are quite long and complicated for the average user (myself included) to use on a daily basis.
 The method I used in the above image was from a program called XYZ Mesh, v3. XYZ Mesh is a program used to generate 3D data and images from XYZ or MESH inputs. It is the only program available that exports all converted data into Excel’s native formats. What this means is once the data is convert it’s possible to export the data directly into a new Excel document or copy and paste it into a preexisting one. Once exported into Excel, XYZ Mesh will take the next step for you and graph your data. Needless to say that if you copy and paste the data into a preexisting document you will have to graph the data manually.

When creating a 3D Surface Graph inside Excel XYZ data is only part of what you need. Yes, it is correct that XYZ data contains all your values needed to create a Surface Contour, but Excel needs it in a MESH format. Trying to create a Surface Graph in Excel by using data in an XYZ format will result in a elongated graph that is only three measures deep, as shown in the adjacent image.
What is a MESH format? The best way to describe it is like a series of Rows, Columns and Cells; which X values will be representing the Rows, Y values the Columns and the Z values the Cells. With this formatting Z values will be lining up corresponding X and Y values. The image below shows an example of such data. This data can be added in by hand or transposed automatically with a third party application, like XYZ Mesh.


Once transposed some of the data is left blank which results in a very jagged looking Surface Graph if plotted. The blank areas around the Z values in the MESH format are automatically assumed to be zero. Having this means that Excel believes these are data points and not empty values. The only way to fix this is to send the data through a conversation process to curve empty values around known data points. If this sounds complicated that is because it is, that is unless you have a conversion tool that does it for you. Currently (at the release of this article) XYZ Mesh is the only application that will curve XYZ data into a completed MESH format for Microsoft Excel graphing.
 XYZ Mesh comes with an automatic curve algorithm used to calculate all values in proximity to one specific cell. This allows XYZ Mesh to accurately calculate how many cells are between each value and generate a calculation for the theoretical element that is missing.
 In short, it does the math so you don’t have to. XYZ Mesh also saves you a great deal of time and effort with the ability to export the curved data directly into Microsoft Excel. It even has a little added bonus for those of us that use MESH graphing for data interpretation. Metrology, surveying, well boring and various other companies require an easily understood method of explaining and displaying results to customers. XYZ Mesh comes with a customizeable window when exporting data into Excel. In this window the user can specify many custom fields including the surveys location, client name, date, and even information about your company.
When the curved data is graphed it is displayed as a perfectly curved 3D rendition of the once flat lineal XYZ data.

Conclusion
 Excel is great for many things, but complex graphing is not one of them. While yes it can do basic charts actual 3D is quite difficult and time consuming. XYZ Mesh takes all the frustration of making 3D charts and changes it into a single click solution.
If you would like to know more about XYZ Mesh and its capabilities you can visit the webpage here. XYZ Mesh comes with its own built-in 3D graphing capabilities, so you can graph your data as you convert it. Exporting the data into Excel is also just as easy. If you would like to see a couple samples of the exported data please follow the links below:
Excel 3-D Surface - Excel 3-D Wireline - Excel Contour
If you like this post and would like to subscribe to our newsletter to learn more about Gray Technical please follow this link.
As always if you would like to contact us for help or information please email us at support@graytechnical.com
![]()
 Previous Post


